Last month we argued “stock market participation is too broad for an imminent cyclical top to form,†and we’re not retreating from that statement. But interim market tops of varying degrees of importance can form with little or no warning, and we think the July 24th S&P 500 high will go into the books as either a short or intermediate-term top of some significance.
We’ve characterized stock market action alternately as uniform or in gear throughout most of 2014, but it’s clear that market participation—as healthy as it appeared until late July—has not been nearly as “egalitarian†as it was throughout 2013.
Throughout the spring and early summer, we marveled at how well measures of market breadth were able to shrug off Small Caps’ dramatic relative strength breakdown. But our breadth work, including the NYSE Daily Advance/Decline Line, couldn’t escape the impact of a steep (–6%) July drop in the Russell 2000. (Chart 1)
Chart 1

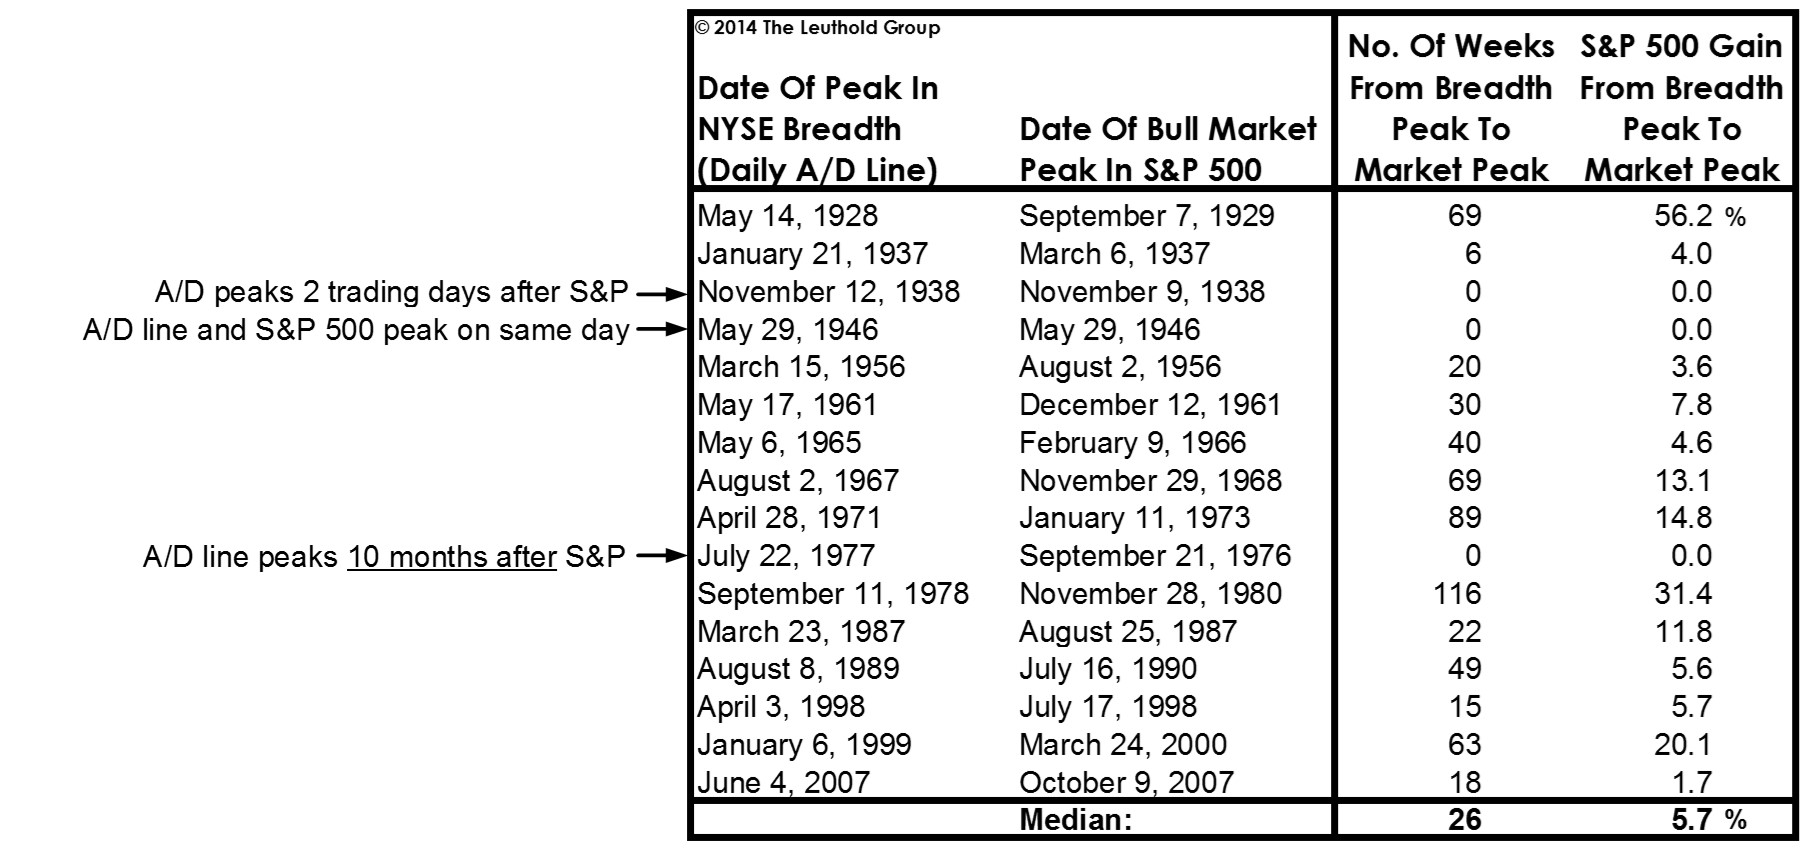
While breadth weakness is troubling (and one of the numerous factors that drove the MTI to neutral status), remember that peaks in market breadth tend to lead peaks in the S&P 500 by at least a few months. For example, the NYSE A/D Line’s peaks have tended to lead the S&P 500 eventual bull market top by a median 26 weeks, with a typical additional index advance of about +6% during that span (Table 1). There’s a decent chance, then, that the late-summer ugliness we’re expecting could be followed by new bull market highs (and perhaps the final highs?) in the fall.
Table 1
With the stock market’s most recent price peak having occurred only two weeks ago—and its internal peak (i.e., breadth) only one month ago—it’s probably too soon to conclude (though not too soon to worry) that a terminal distribution phase is now underway.
It’s possible, though, that conventional breadth measures overstate the internal health of the stock market. This year’s bond market rally has helped prop up the preferred stocks, closed-end bond funds, and regional bank and utility stocks that figure prominently in the traditional NYSE breadth tallies. (We rarely complain about this “bias,†believing instead that such interest-rate sensitivity accounts for much of these breadth measures’ predictive value.)
Equal-weighted stock market indexes, on the other hand, point to more internal difficulty for managers than either breadth indicators or cap-weighted indexes would suggest. The “average stock†within both the S&P MidCap 400 and S&P SmallCap 600 has been particularly weak after peaking (on a relative strength basis) near year-end (Chart 2). A similar pattern may have begun in the S&P 500, but the downdrift is too immature to declare it a new trend.
Chart 2

The “equal-weighted†perspective on stock market breadth portrays a benchmark that’s suddenly become difficult to beat. Over the 12 months ended July 31st, only 37.6% of stocks (Chart 3) in the S&P 1500 SuperComposite managed to outperform the S&P 500. This is a huge decline from year-end 2013, when the figure stood near 60%. Ominously, a similar pattern occurred just before the October 2007 bull market peak. Then again, the S&P 500 was able to rise throughout most of the late 1990s while this broad “participation†figure was in a freefall. So, yes, the S&P 500 has been a tougher bogey to beat for active managers… but this condition can persist for a long time before the blue chip indexes eventually succumb to the bear claws.
Chart 3

© 2014 The Leuthold Group


