We briefly review the interplay of the global and regional (Europe and Asia) business cycles and where we stand. It turns out that the global business cycle is muddling through, continuing deceleration of China is still trying to find bottom and Germany recently turned the corner and is back to deceleration. While this state of affairs is no news the interesting aspect of this regional interplay which we want to bring to your attention is that US is helped and lifted by deceleration of both neighbors. That said US itself is in a mixed state.
As we mentioned before[1] the OECD Composite Leading Indicators (CLI) dataset is a great tool to analyze the interplay of the business cycles. It is updated on a monthly basis and is available substantially more timely than the other OECD Main Economic Indicators (MEI) datasets. Currently the latest release date is 8-Aug-2014 and it corresponds to June 2014 data. For the analysis below our start year is 1990, the year when China dataset starts.
As it turns out the big picture in interaction of countries and regions business cycles is pretty straightforward and regional business cycles are mostly driven by interplay between Global, European and Asian drivers. We decompose all major countries and regions leading indicators into these three driving factors (Global, European and Asian) and this would explain most of the variance in their dynamics.
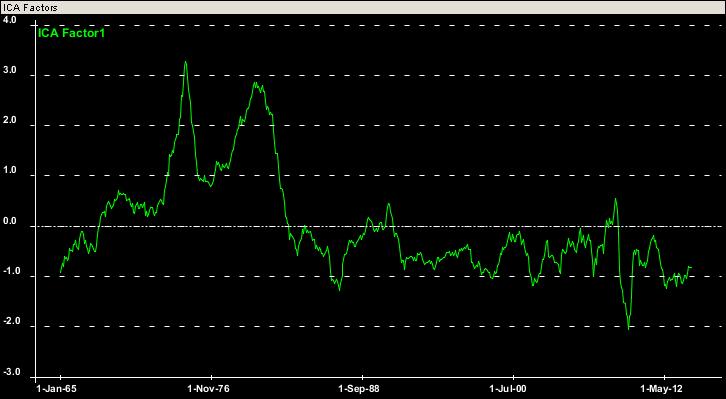
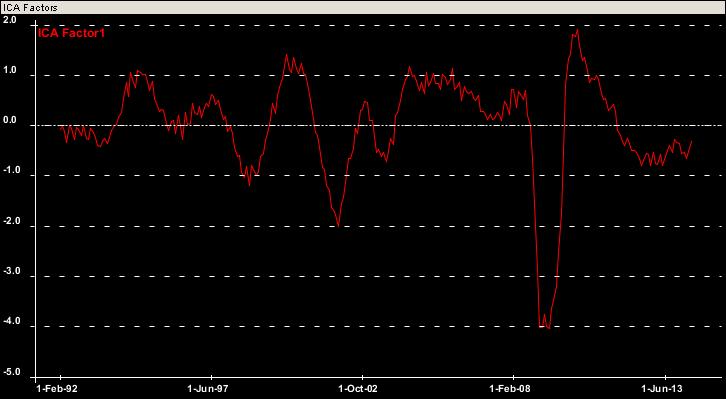
Firstly there is a Global business cycle factor:
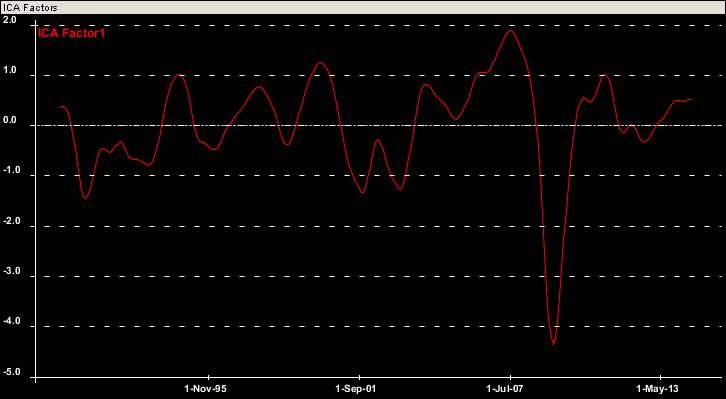
Based on the chart, after the August 2012 bottom and subsequent growth it appears to be in a stable muddle through state which is pretty unusual.
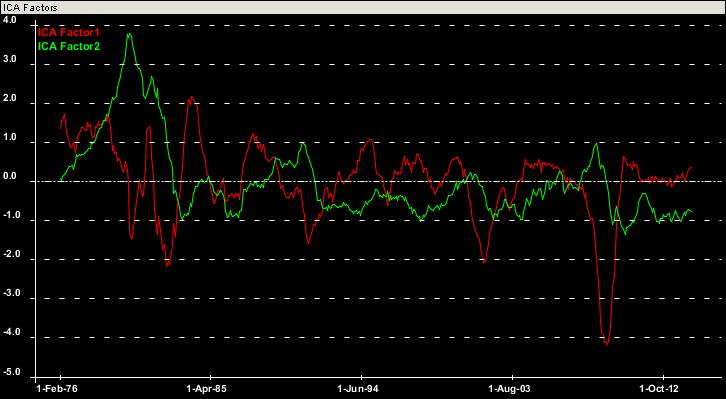
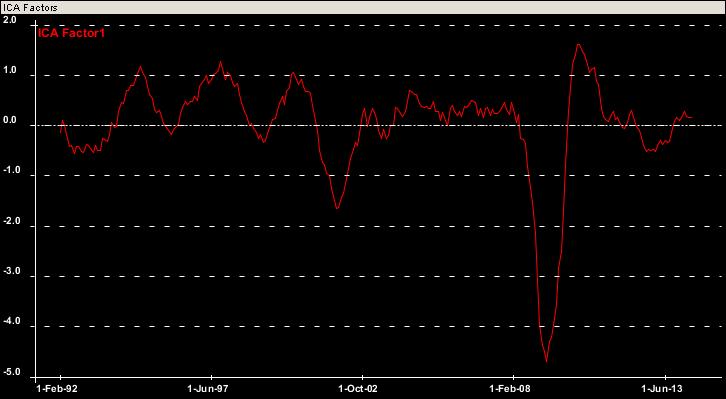
Secondly there is European idiosyncratic factor:
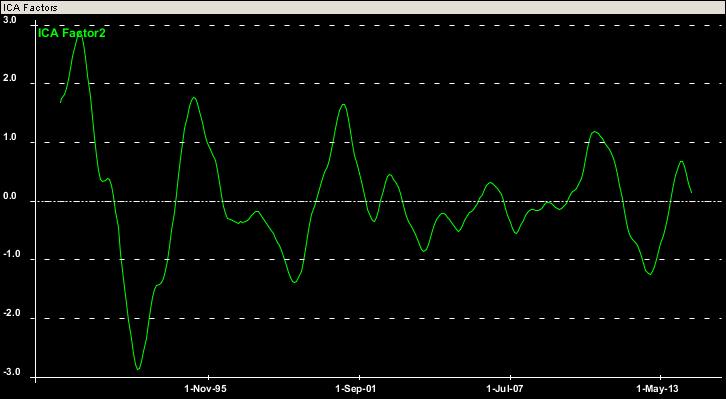
It basically corresponds to the outperformance of Europe versus Global Factor. The most recent recessionary bottom in Europe was in November 2012 with the recovery peaked this winter in February 2014. The recent Germany negative GDP print confirmed the deceleration.
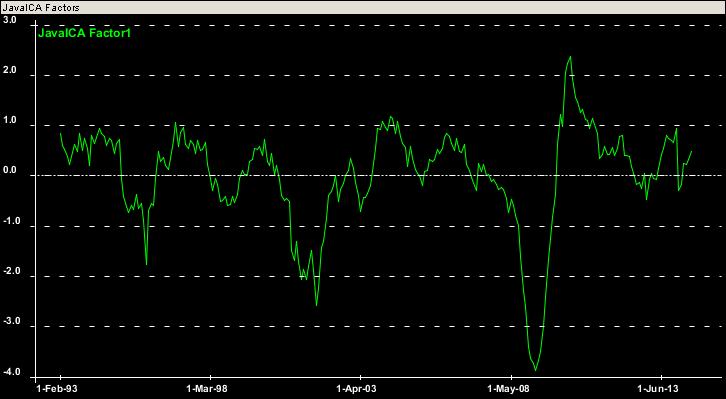
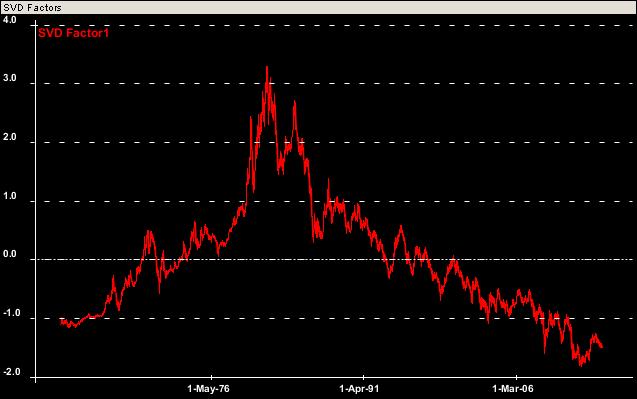
Thirdly there is Asian idiosyncratic factor:
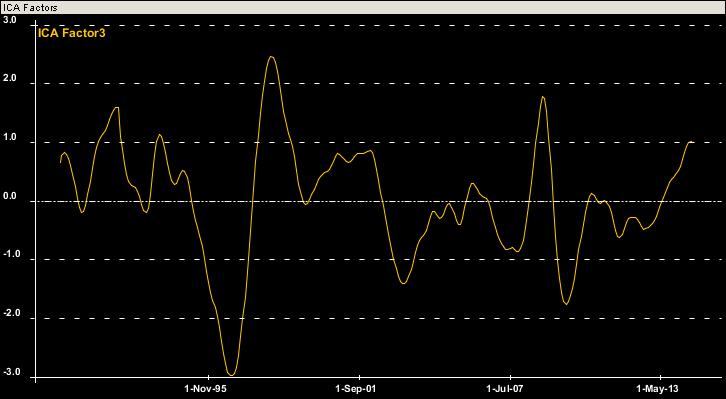
Positive value of it corresponds to Asia underperforming the Global Factor. Based on the chart, there was substantial out- and under-performance prior to and after the 1998 Asian financial crisis. During the Global financial crisis Asia underperformed in 2008 and outperformed in 2009 driven by Chinese aggressive stimulus. It appears Asia (China in particular) lost bottom starting at the end of 2012 with signs of stabilization during the last couple of months are inconclusively visible in possible turning point at the end of the chart.
So how do these three drivers/factors comprise the individual countries business cycles?
Let us just review three major examples: US, Germany and China.
US Factor Composition
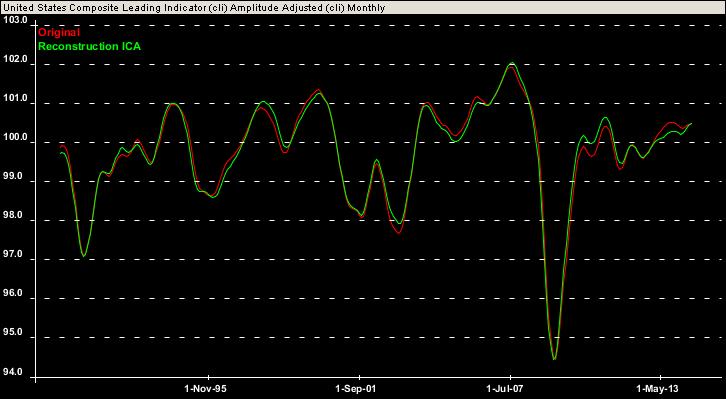
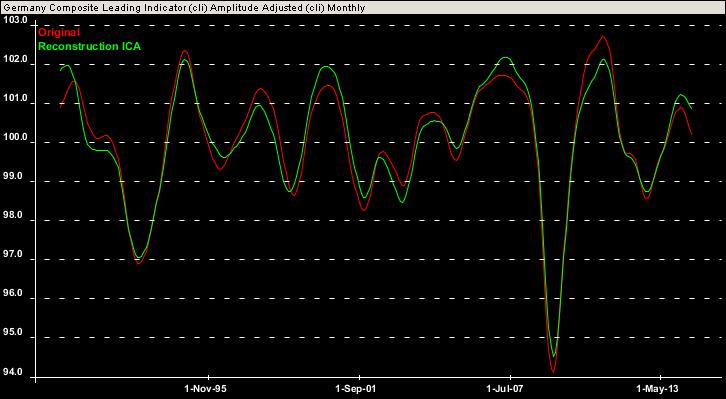
The United States is mostly driven by the Global factor (Factor1) but it is also being helped by hurting Europe (Factor2) and hurting Asia (Factor3), though less so. So the recent European recession helped the US to avoid recession and the most recent European slowdown is helping again, so does ongoing Asian slowdown. On the chart below one can see the US leading indicator (red) and the reconstruction of it (green) based on the three factors decomposition:
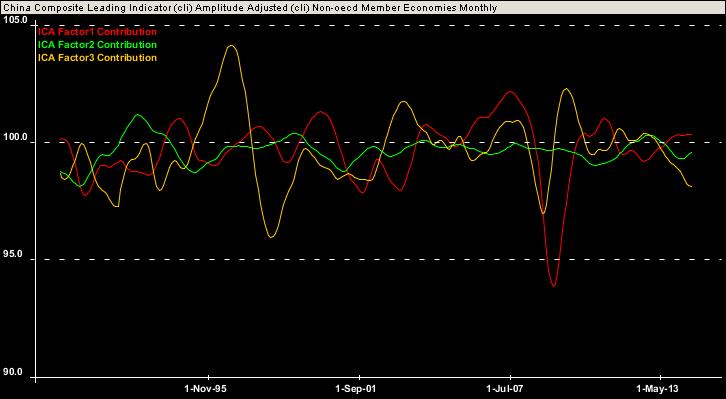
Below is the contribution of each individual factor:
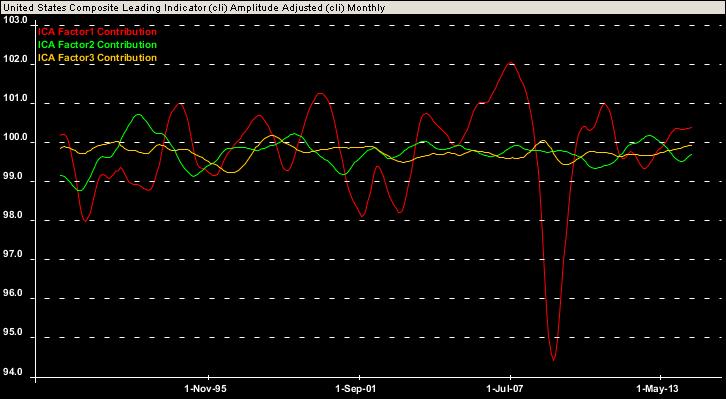
You can see that both the recent Europe deceleration (green) and ongoing China slowdown (yellow) lift the US somewhat. In fact it is the only source of acceleration during the last year.
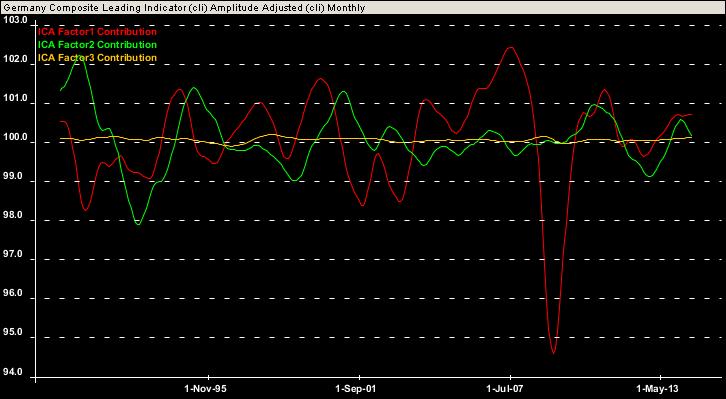
Germany Factor Composition
The Global factor (Factor1) is of major importance for Germany along with the European factor (Factor2) with little direct sensitivity to the Asian factor. Recently Germany decelerated more so than expected based on European factor which hints at it being the driver of this deceleration.
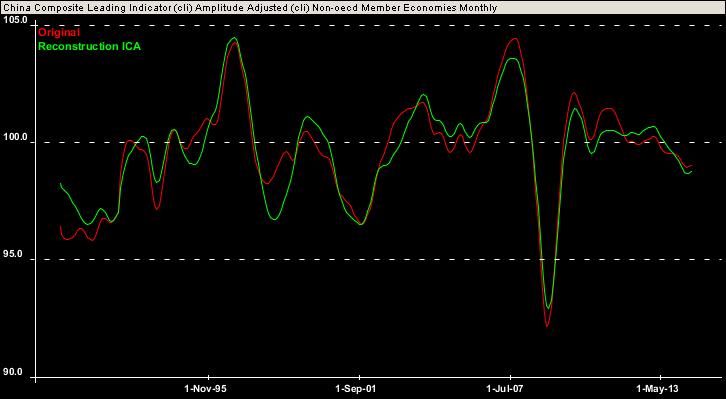
China Factor Composition
Though the Global factor (Factor1) along with Asian factor (Factor3) are of the major importance, it also slightly helps China when Europe hurts (Factor2). So the recent European recession helped China and the recent slowdown is helping again (this is unlike Asia in general to which (because of Japan) on contrary, the European recovery helps and slowdown hurts).
US Review
Let us finish with a quick review of the ongoing situation in our US[2][3][4][5][6][7] indicators set:
Growth leading indicator:
Inflation coincident indicator:
Growth and inflation coincident indicators:
World trade:
World industrial production:
Yield curve level factor:
Yield curve slope factor:
GDP based leading indicator:
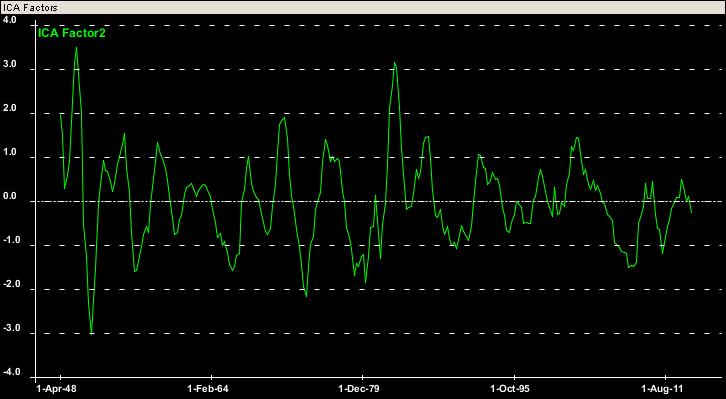
It appears that since 1948 (when Quarterly GDP data set starts) GDP components are driven mostly by two factors. First of them is growth and second is some sort of a leading indicator depicted above. This leading indicator/factor appears to predict tops and bottoms of growth factor 2-3 quarters ahead quite consistently over the last 65 years. More precisely this leading factor predicts annual velocity of GDP two quarters ahead with surprising accuracy (R^2=0.4).
Below we depict it together with GDP growth and one can see that it predicts peaks and bottoms consistently ahead:
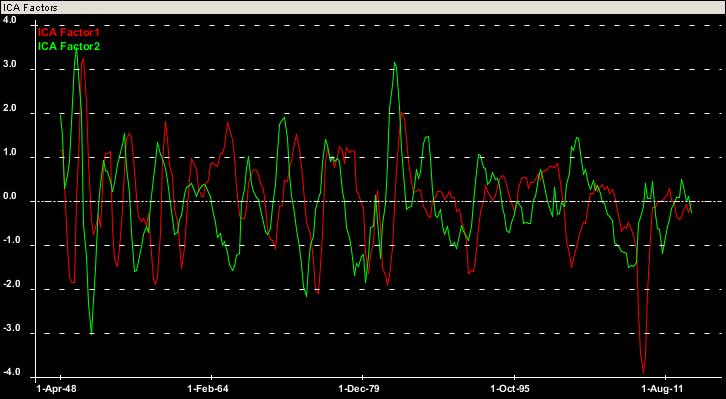
So this quarterly leading indicator (leading by 2-3 quarters) is heading downwards. Together with yield curve dynamics this is pretty concerning and we would look forward to monthly GDP revision data to see it this indicator value would change.
[1] Dynamika Commentary, “The global interplay of business cycles”, 31 May 2014
[2] Dynamika Commentary, “Where are we in the business cycle?”, 17 November 2013
[3] Dynamika Commentary, “When recent US growth is to turn around?”, 30 January 2014
[4] Dynamika Commentary, “Where do the leading indicators lead?”, 28 February 2014
[5] Dynamika Commentary, “Watch out for the late cycle symptoms”, 30 March 2014
[6] Dynamika Commentary, “Monitoring the late cycle symptoms”, 1 June 2014