Recently, we wrote about the potential disconnect between the weak performance of the economy as measured by gross domestic product (GDP) in the first quarter of 2014 and the run of strong economic data for April, May, and June 2014. On balance, the economic data released in recent weeks for July 2014 continued to meet or exceed analysts’ expectations, including data released last week (July 28 – August 1, 2014) on second quarter GDP, July employment, and the July readings on the Institute for Supply Management’s (ISM) manufacturing survey and vehicle sales. In this week’s commentary, we’ll examine whether or not a reconnect has occurred and also revisit Federal Reserve (Fed) Chair Yellen’s labor market dashboard in the wake of the release of the July 2014 Employment Situation report as Fed officials prepare for the Kansas City Fed’s Monetary Policy Symposium at Jackson Hole, WY on August 21 – 23, 2014.
Disconnect Reconnected?
In our July 7, 2014 Weekly Economic Commentary, we posed the question:
The rapid improvement in the labor market, and in other economic data reported over the past several months, is at odds with the 2.9% decline in gross domestic product (GDP) in the first quarter of 2014. Which is correct?
With the release of the GDP figures for the second quarter of 2014 (along with revisions to the data back to 1999) the disconnect appears to be fading, and the data released so far for the third quarter (vehicle sales, ISM, initial claims, employment, vehicle sales, etc.) suggest that the underlying economy had decent momentum as the third quarter began. Inflation-adjusted GDP rose at a 4.0% annualized rate in the second quarter of 2014, and the revised data show that GDP growth was 3.5% or higher in three of the past four quarters dating back to the third quarter of 2013; the exception was the 2.1% decline in GDP in the first quarter of 2014, which now looks even more like a weather-related outlier. The readings from the ISM manufacturing report corroborate the strength seen in the GDP report.
The July 2014 reading on the ISM was 57.1, well above the consensus expectation (56), and also well above 50. A reading above 50 on the ISM indicates that the manufacturing sector is expanding, while a reading below 50 signals that the manufacturing economy is contracting. Additionally, a reading above 43.2 on the ISM suggests that the overall economy is expanding. In a comment accompanying the report, ISM noted that the average year-to-date reading on the ISM (54.4) is consistent with real GDP growth of 3.7%. ISM also noted that if the index remained at 57.1 over the final two months of the third quarter, it would be consistent with 4.6% GDP growth.
Another piece of the disconnect had been the tepid pace of job growth in late 2013 and early 2014, which we chalked up to the poor weather, while others suggested it was a sign of overall weakness in the economy. The July 2014 Employment Situation report (released on Friday, August 1, 2014) helped to resolve the disconnect and supported our view. During the harsh winter of 2013 – 2014 (December 2013 through March 2014), the economy added an average of just 163,000 net new jobs per month. As the weather normalized in the spring and early summer of 2014, job growth accelerated to 260,000 per month for the four months ending in July 2014. The economy has now generated job growth of 200,000 or more per month over the past six months, the longest stretch of 200,000+ monthly job gains since 1997, when the economy was growing at nearly 4.5% (please see our Weekly Economic Commentary -- FOMC: Need to Know from June 16, 2014 for more details).
In addition to job growth, the July 2014 Employment Situation report also provided an update on the unemployment rate. The unemployment rate ticked up to 6.2% in July 2014 from 6.1% in June 2014, but has declined by 1.1 percentage points over the past year -- and is nearly four percentage points below its cycle high of 10.0% in 2010. We viewed that July 2014 jobs report as a “payback for the payback” -- a pause in the labor market after a strong run of reports in the spring and early summer after the unusually harsh winter of 2013 – 14.
For more details about Janet Yellen’s labor market indicators, please see our Weekly Economic Commentary: Janet Yellen’s Employment Report from March 3, 2014.
On balance, the reports released last week all but confirmed that the 2.1% drop in GDP in the first quarter was an aberration due to severe weather. Looking ahead, the data in hand continue to suggest that the U.S. economy is poised to post growth in the second half of 2014 above the long-term run rate of the economy.
The Yellen Dashboard
Earlier this year -- in testimony before the Senate Banking Committee, in her post-Federal Open Market Committee (FOMC) press conferences in March and June 2014, in testimony before the Joint Economic Committee (JEC) of Congress, and in other public appearances -- Fed Chair Yellen has mentioned several labor market indexes that she and other FOMC members are watching closely.
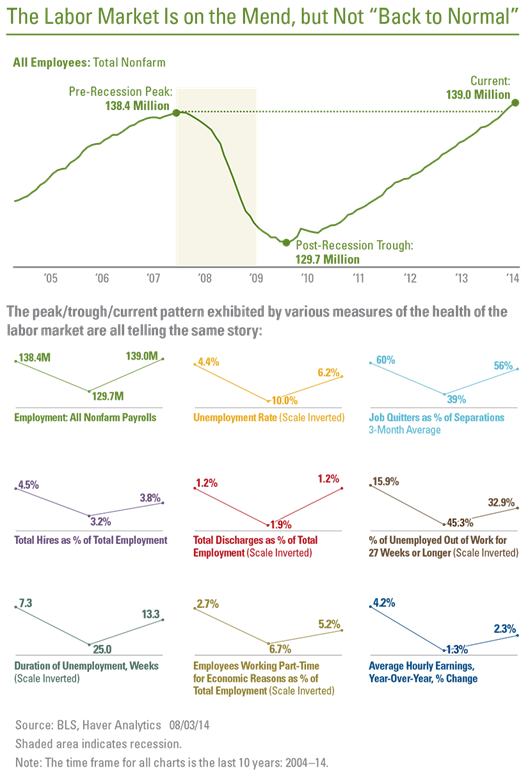
The infographic details the performance of nine key labor market metrics mentioned by Yellen in these recent public appearances. As we have noted in recent months in this publication, although most metrics have partially recovered from their Great Recession nadirs, only a few have returned to “normal.” Until they do -- or at least until they make significant progress toward normal -- markets should expect that the Fed will be content with keeping its fed funds rate target near zero. In our view, the Fed is not likely to begin raising rates until late 2015, or even early 2016.
The opinions voiced in this material are for general information only and are not intended to provide specific advice or recommendations for any individual. To determine which investment(s) may be appropriate for you, consult your financial advisor prior to investing. All performance reference is historical and is no guarantee of future results. All indices are unmanaged and cannot be invested into directly.
The economic forecasts set forth in the presentation may not develop as predicted and there can be no guarantee that strategies promoted will be successful.
The Bureau of Labor Statistics is a government agency that produces economic data that reflects the state of the U.S. economy. This data includes the Consumer Price Index, the unemployment rate and the Producer Price Index.
This research material has been prepared by LPL Financial.
To the extent you are receiving investment advice from a separately registered independent investment advisor, please note that LPL Financial is not an affiliate of and makes no representation with respect to such entity.
Tracking #1-295973 (Exp. 08/15)
© LPL Financial


