"Be brave when others are afraid, and afraid when others are brave."
-Warren Buffet
This summer the streets are sizzling… and so is the stock market. To the chagrin of value investors, US equities have not experienced a normal correction since May 2013. But what is “normal” and what is “hot”? This article discusses a behavioral measure of market extremity, the put/call ratio, and offers some basic advice for dealing with the current environment.
Put/Call Ratio
We all know that financial markets swing from excessive greed to excessive fear. The put/call ratio is one measure of this phenomenon. The indicator measures the activity in put versus call options. When put volume is relatively high, investors are frightened. When put volume is relatively low, investors are complacent or greedy. Extreme readings in either direction provide useful, contrarian signals to the detached observer.
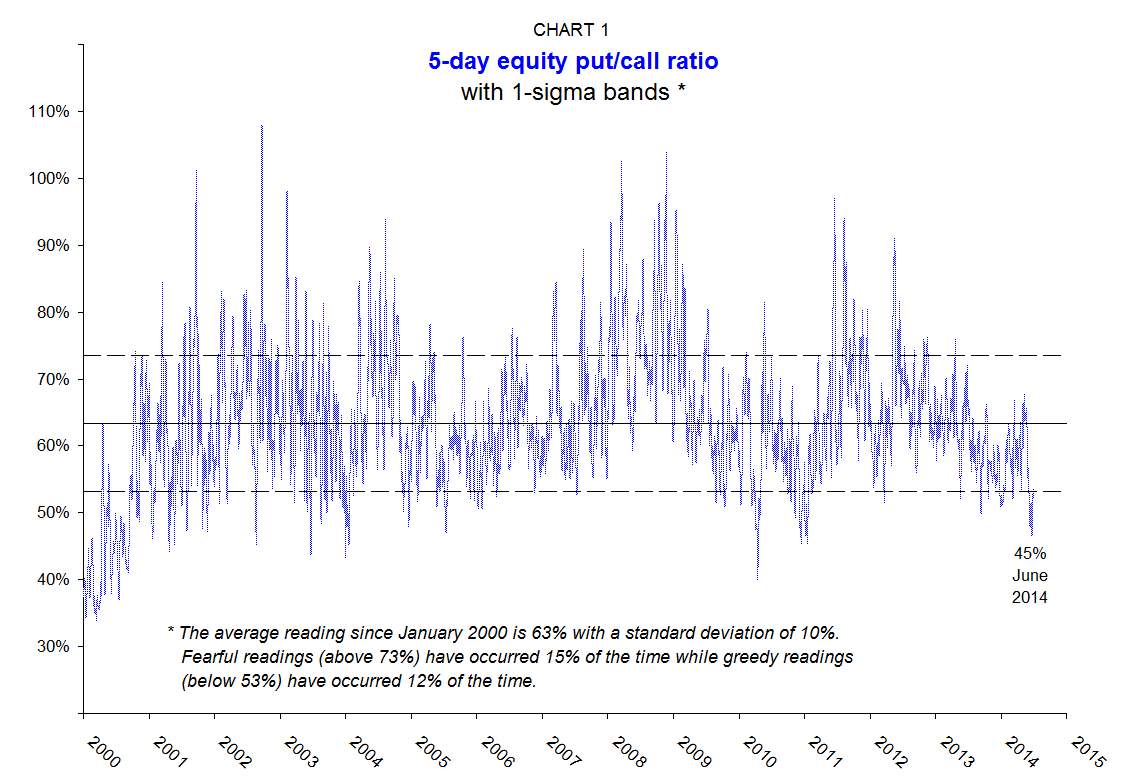
Chart 1 presents the 5-day put/call ratio back to January 2000, a period with plenty of ups and downs. The average reading over this time span was 63%, with a standard deviation of 10%. The chart portrays a choppy, sideways oscillation contained mostly within the 1-sigma range. Fearful readings above the upper band occurred only 15% of the time. Greedy readings below the lower band occurred only 12% of the time, with the most recent examples in June/July of 2014.
Now that we understand the basic concept, let’s take another view. Chart 2 plots the S&P 500 Index, flagging 1-sigma variances in the put/call ratio. This “heat map” gives us a fair idea of when the market is overbought or oversold – i.e., vulnerable to correction or rally. Note that the indicator does not identify every pivot. Also note that the indicator is best suited for cyclical or swing moves, rather than major directional changes. As with any indicator, the put/call ratio should be understood (and applied) within its limitations.
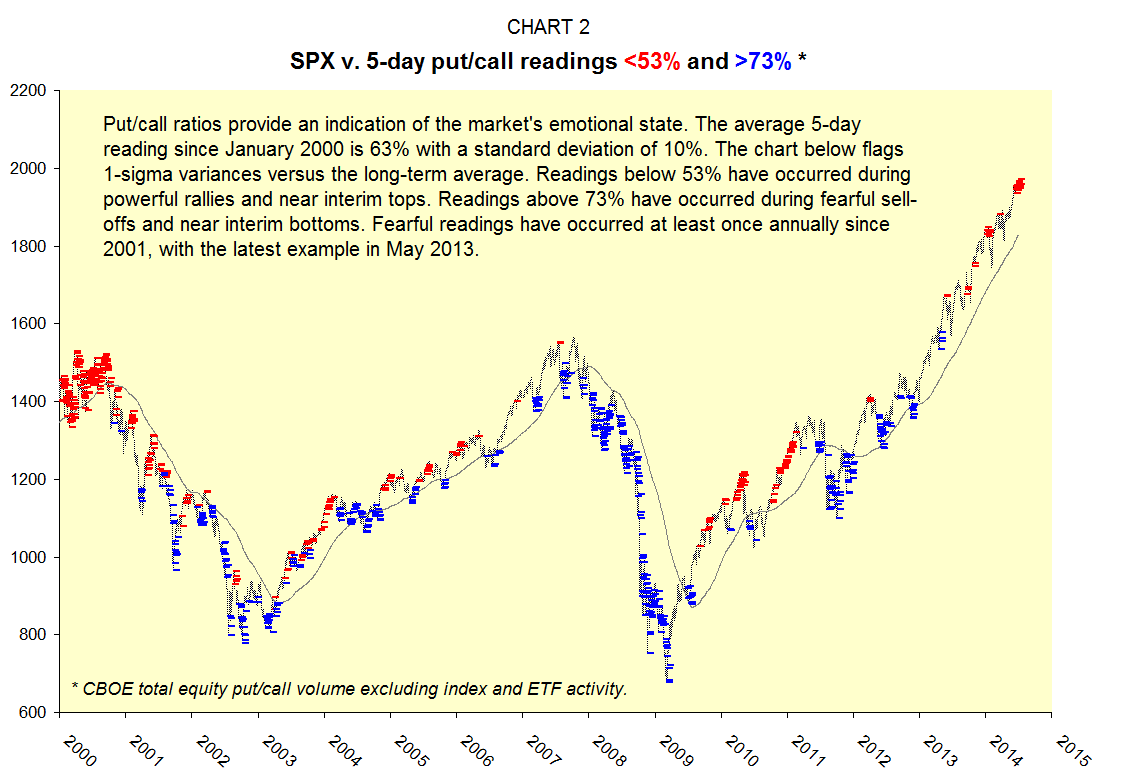
Despite the obvious limitations, Chart 2 provides some very good informational content. We see, for example, that extreme put/call readings are likely to occur at or near market pivots. Given this knowledge, we are able to make some objective assertions about the current environment. First, the market is overbought. Second, the market has not experienced a normal, 1-sigma correction since May 2013. Finally, with the exception of the current run, the market has experienced a normal correction at least annually since the year 2000. All of this suggests a cautionary outlook. Which brings us back to our main subject.
Dealing With Red-Hot Markets
Once a market has been identified as red hot, it’s wise to adopt a contrarian bias. This does not mean that investors should dump all holdings. As illustrated in Chart 2, markets can stay hot for long periods of time. And indicators can and do fail. But investing is a game of probabilities. Incremental adjustments based on objective evidence are likely to pay off over time.
The current situation suggests a conservative bias. In this environment, investors should consider trimming equities in favor of cash or bonds. Rebalancing, as we like to call it, is a normal part of the investment process.
Swapping lower-quality stocks (like GE) for higher-quality stocks (like 3M) is another way of reducing portfolio risk. The quality of a stock is determined by balance-sheet structure, bond-market spreads and trading behavior during past corrections.
In overbought markets, speculative-grade “story” stocks – those being touted based on topical news – should be particularly avoided. This goes double for low-grade, illiquid issuers, especially if they are claiming a cure for baldness or the common cold.
Finally, let’s talk about putting new money to work. This is a particularly thorny issue as new money tends to arrive in sizzling markets, helping to drive prices ever higher. In red-hot markets, investors wishing to increase their equity allocation should adopt a longer-than-normal horizon for gradual market entry. This time frame can always be accelerated if and when a normal correction occurs.
Conclusion
So, there you have it… A succinct guide to red-hot markets, distilled from decades of practical experience and a fair share of painful mistakes.
Fortunately, the rules for operating in overbought markets all boil down to common sense. In the words of Warren Buffet: “Be brave when others are afraid, and afraid when others are brave.” Indicators such as the put/call ratio can help investors navigate the market’s emotional landscape.


