GDP Falls, Consumers Still Spend
Despite a considerably worse-than-expected third estimate to Q1 GDP growth, equity markets finished the week flat to negative with the S&P 500 falling 6 bps and the Dow Jones Industrial Average shedding roughly 0.6%.
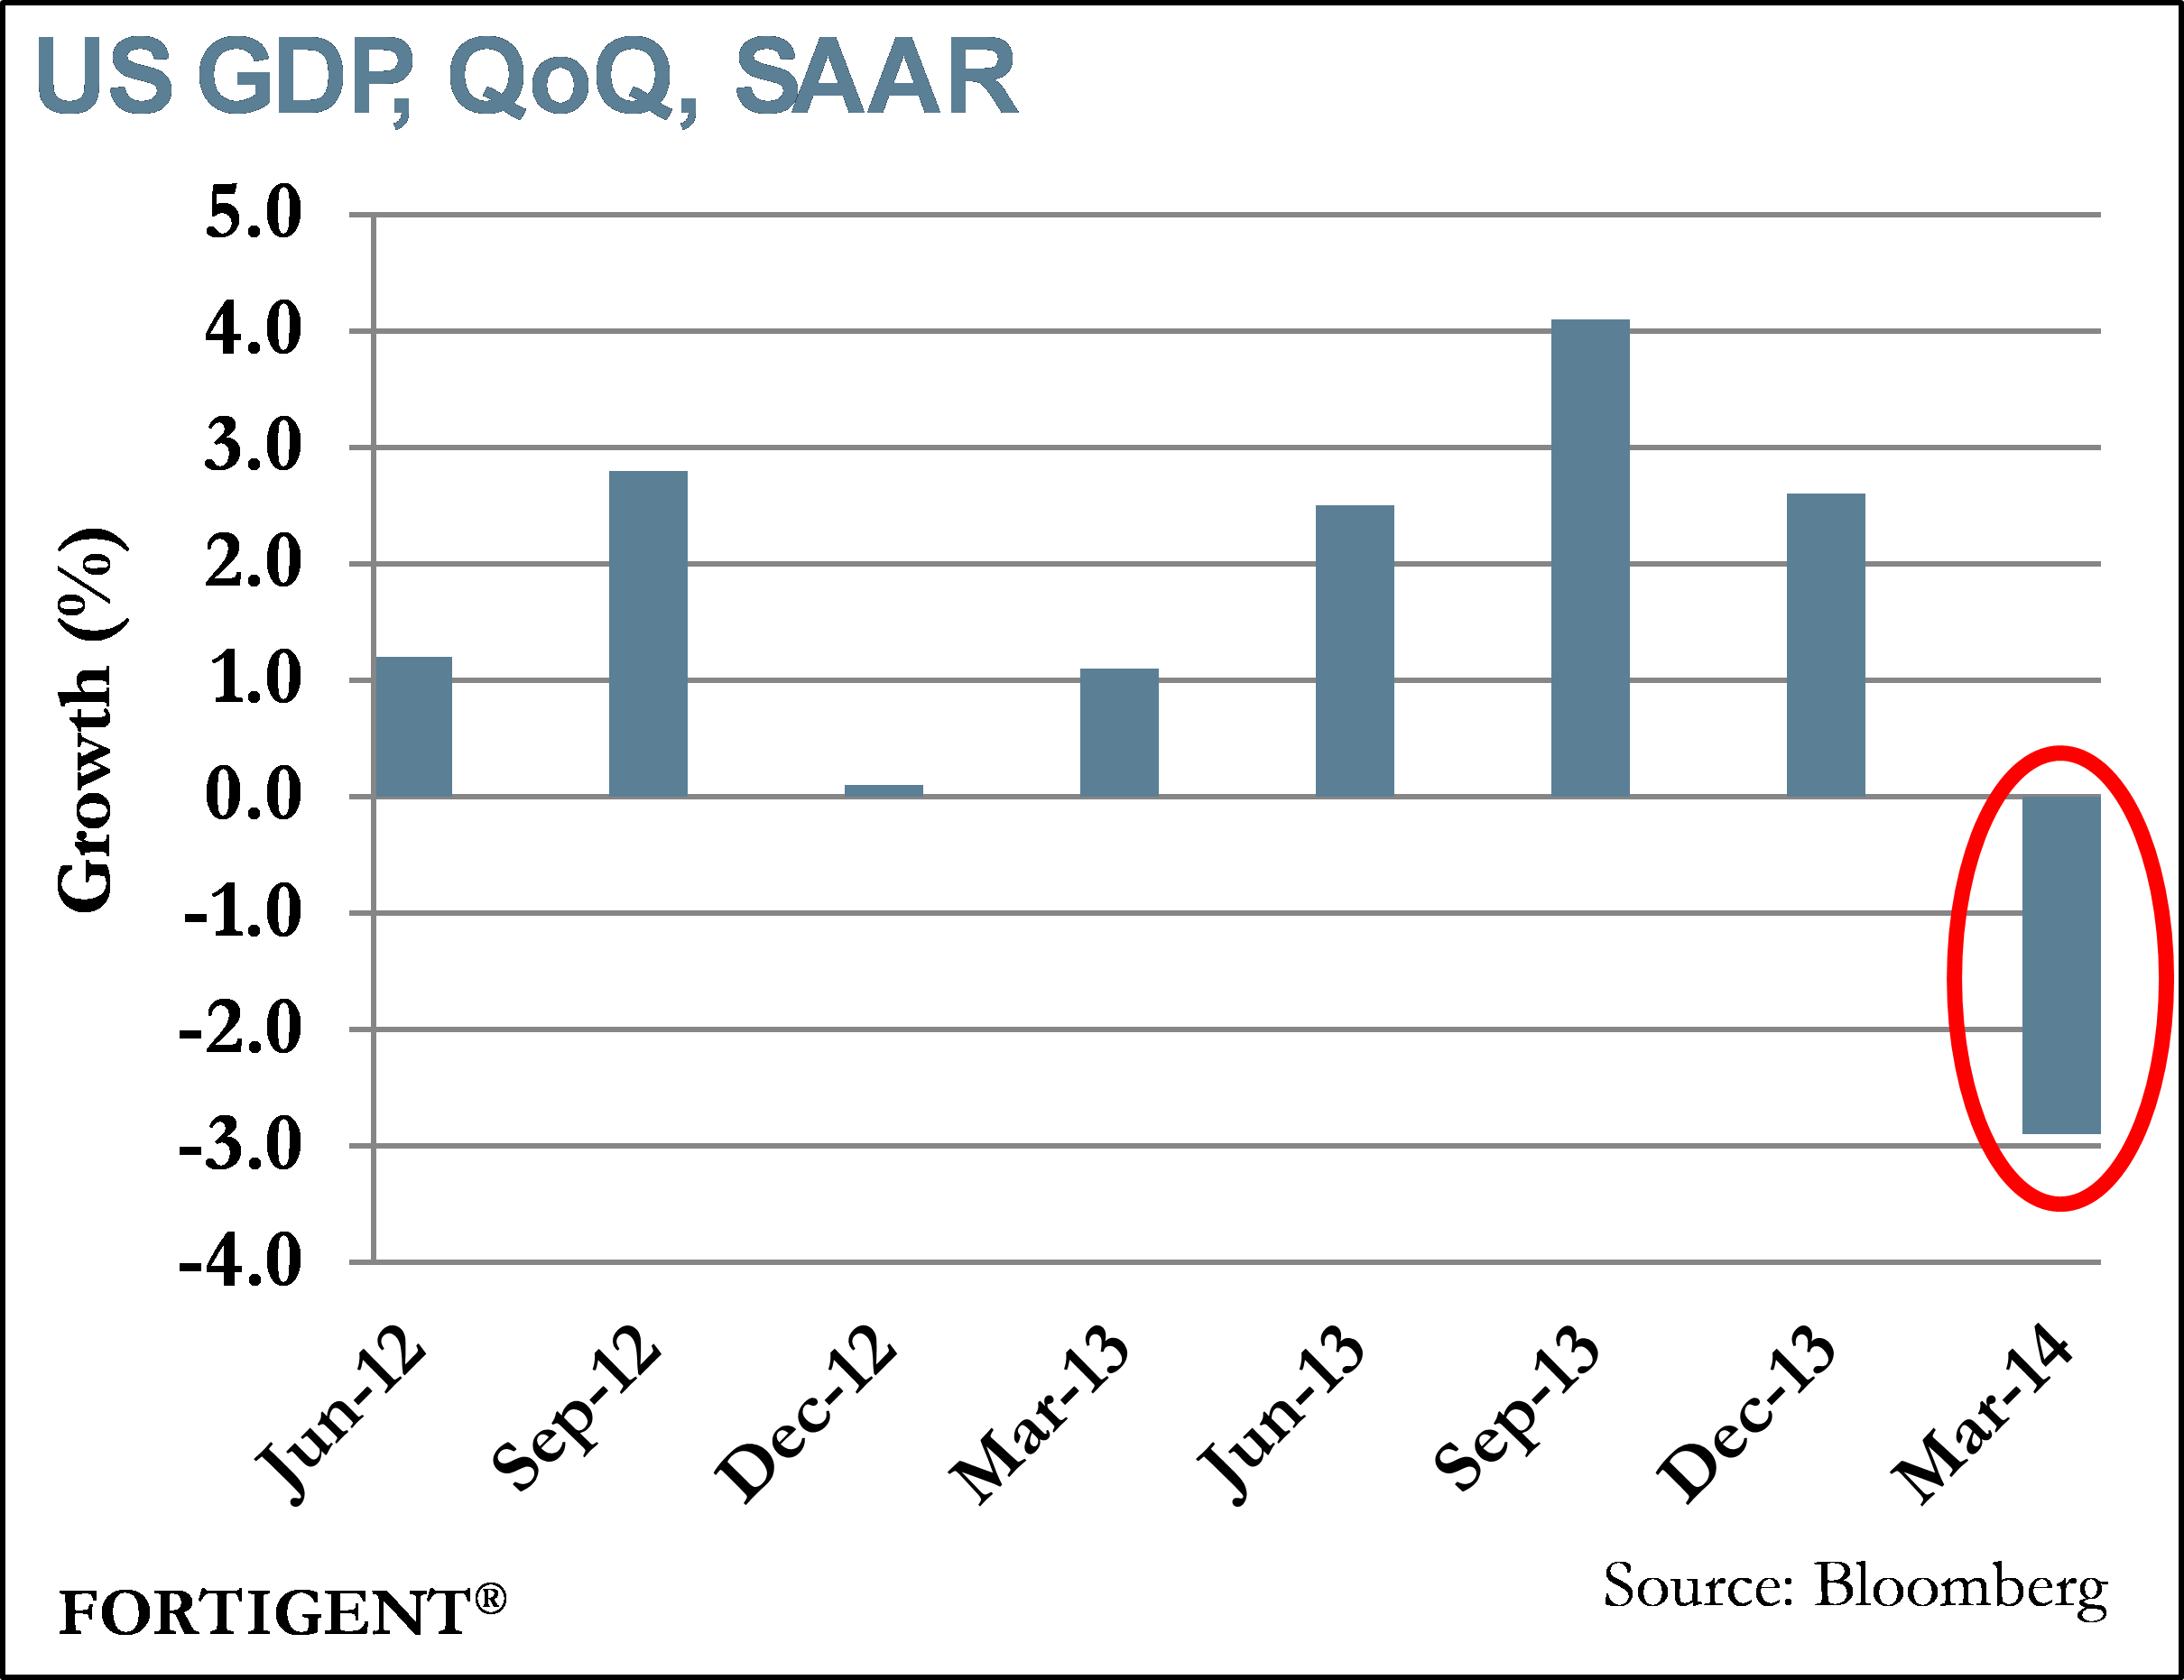
On Wednesday, the Bureau of Economic Analysis released its final estimate for real GDP for the first quarter, which showed that US economic output declined at an annualized rate of 2.9%. Despite declining more than the expected, US equity markets finished the day up approximately 0.5% as investors viewed the decline as temporary. The larger-than-expected downward revision was mainly due to negative revisions in personal consumption expenditures (PCE) and exports.
PCE fell from its fourth quarter 2013 rise of 3.3% to 1.0% in first quarter 2014. The second estimate for first quarter PCE was 3.1%. Durable goods jumped 1.2% while nondurable goods fell 0.3%. Services activity increased 1.5%, but came in well below its previous quarter reading of 3.5%.
The trade deficit widened in the quarter as real exports fell 8.9% and real imports rose 1.8%. This is a considerable reversal from the previous quarter where real exports and imports increased 9.5% and 1.5%, respectively. Export data will be closely watched going forward as companies are allowed to export un-refined US oil for the first time in four decades.
Other notable components to first quarter GDP include healthcare spending and federal government spending. Healthcare spending dipped 1.4% as the US spent $6.4 billion less on health care than in the previous quarter. This number is expected to accelerate in quarters ahead as those who gained health insurance coverage during the first open enrollment period begin to use their new coverage. Federal government spending, in contrast to the 12.8% decrease in the previous quarter, increased 0.6% as nondefense spending jumped 5.9%. This more than offset the 2.5% decline in national defense spending.
Last week also brought a plethora of housing market data. New home sales surged 18.6% month-over-month to 504,000 (seasonally adjusted annual rate). This marks the highest monthly growth rate since May 2008 and first double-digit month-over-month increase since October 2013. The increase in new home sales occurred across all regions, with the Northeast accounting for the majority of the increase as sales jumped 55% from April.
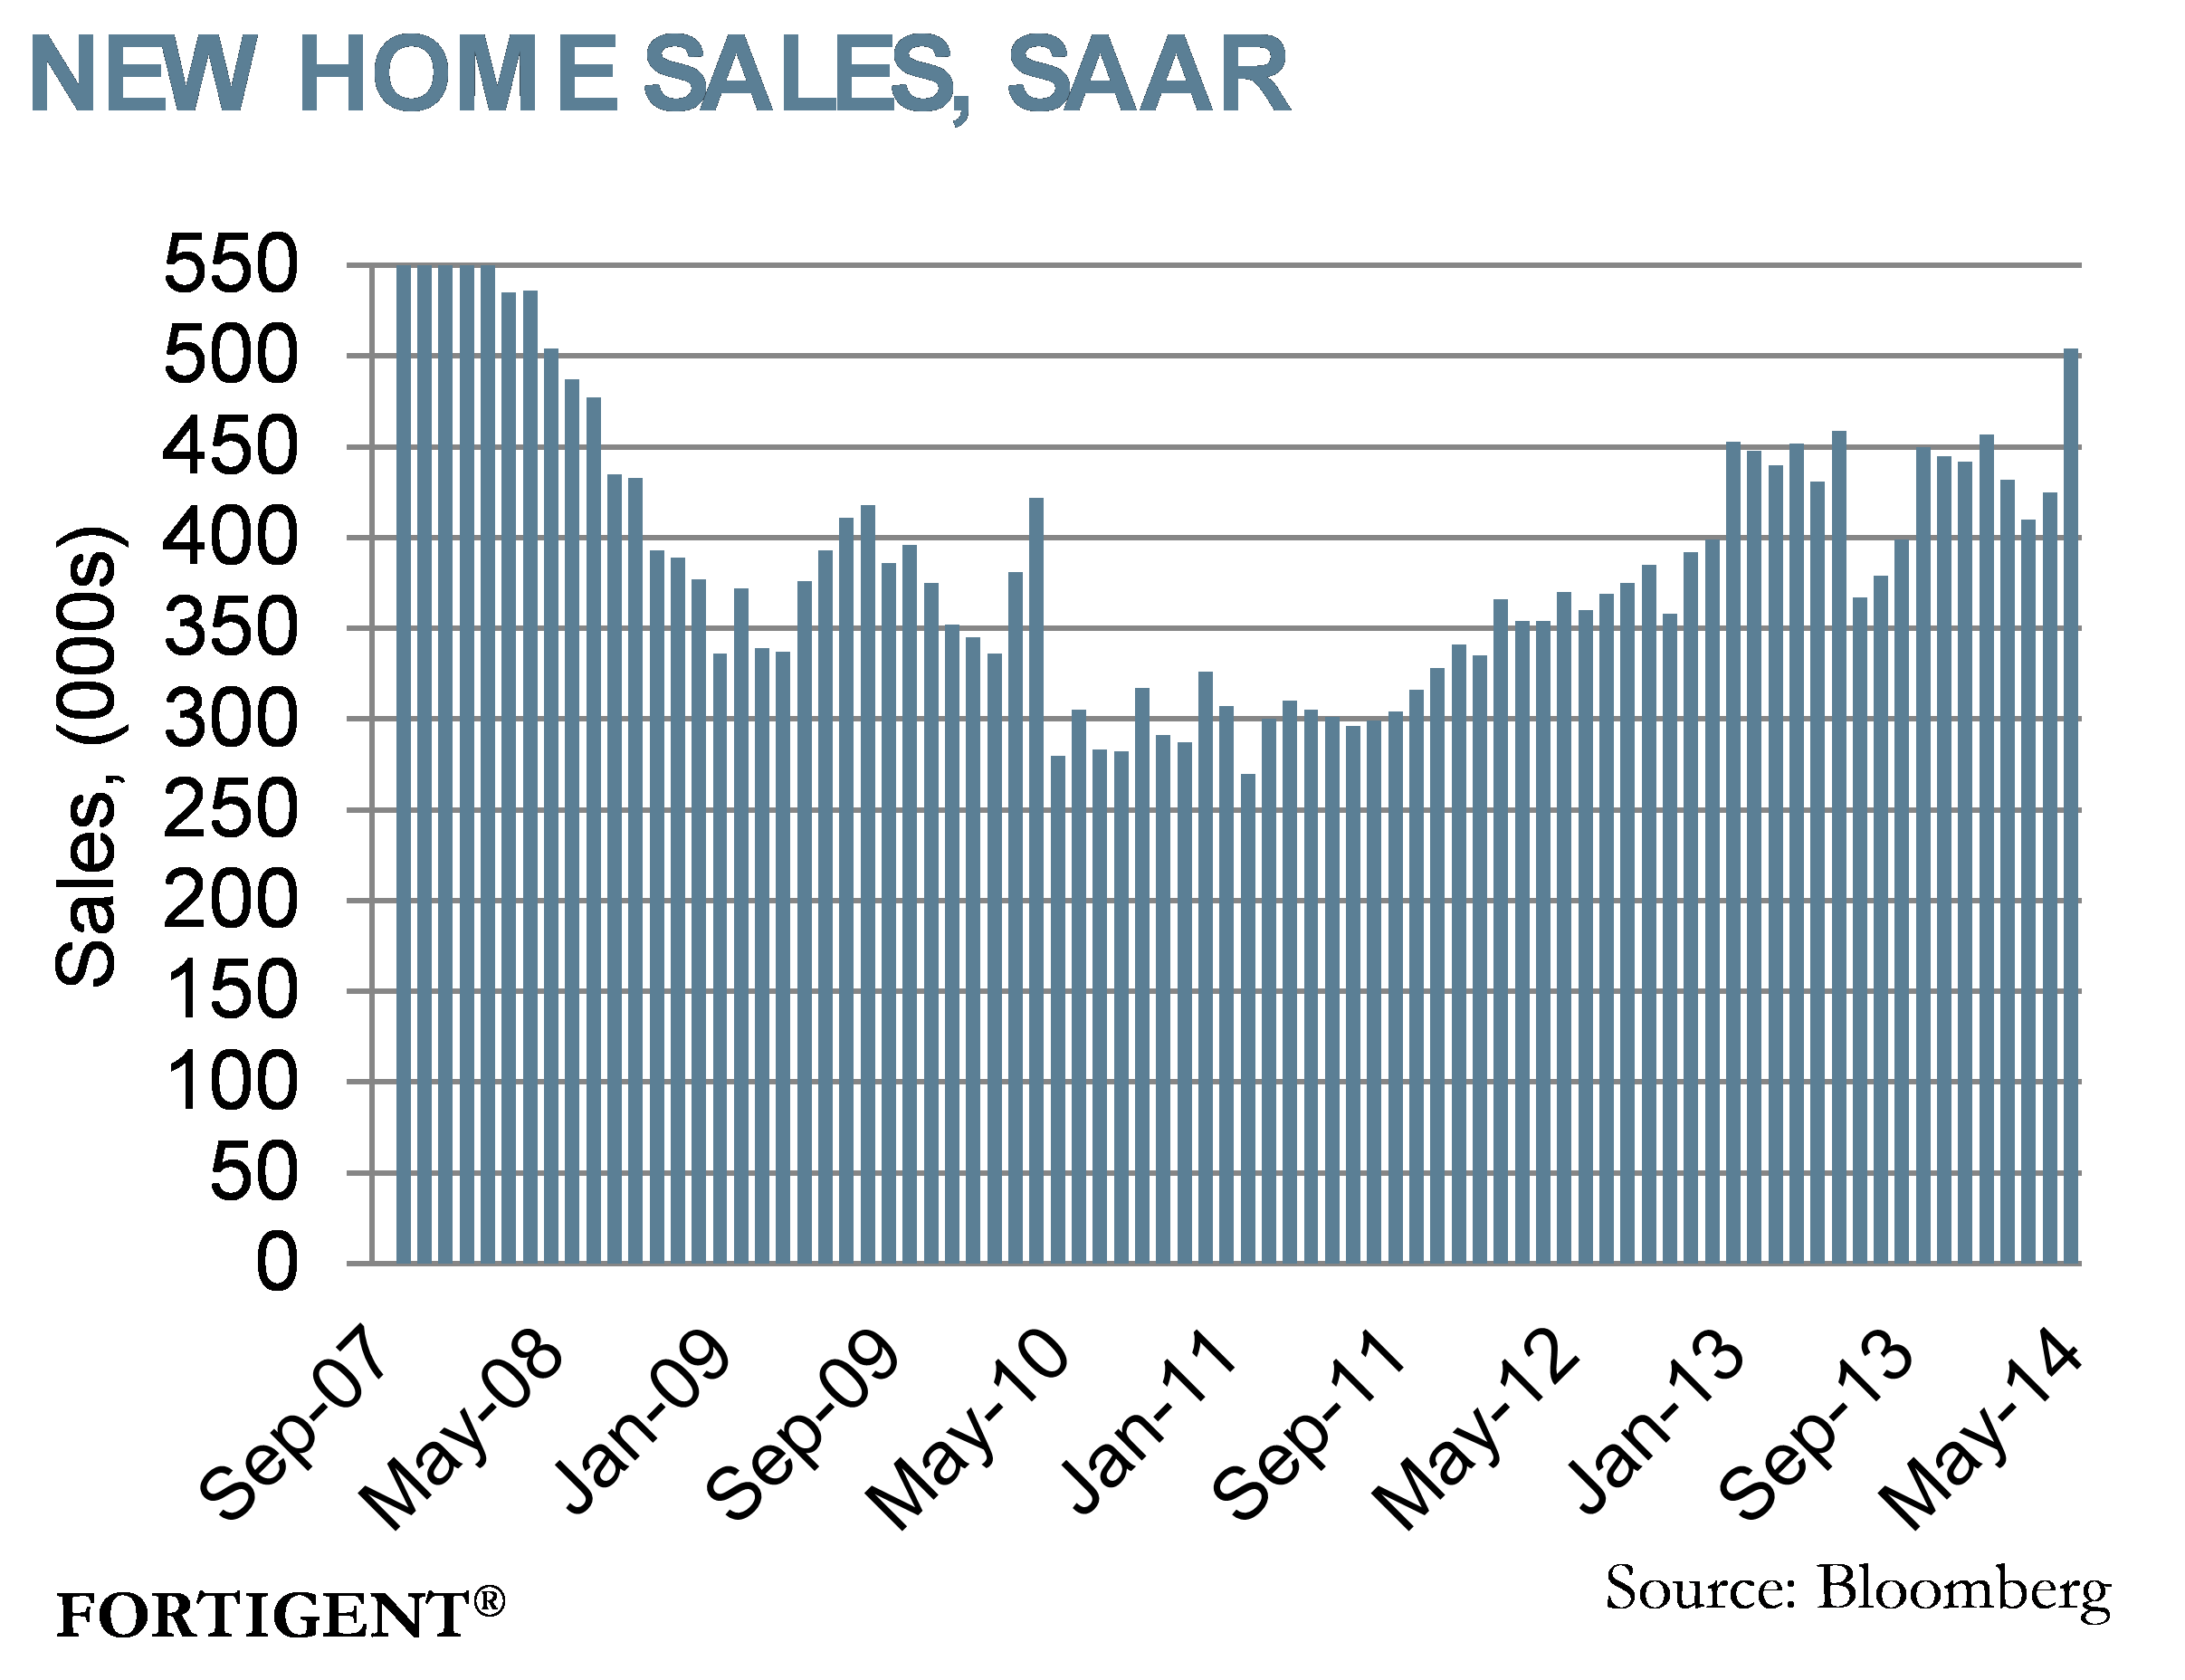
Existing home sales showed continued upside in the housing market as sales increased 4.9% from April. Sales hit 4.89 million (seasonally adjusted annual rate) in May, the highest rate since October 2013. The recent uptick in new and existing home sales comes after severe winter months that suppressed homeowner demand at the beginning of the year.
The S&P/Case-Shiller Index showed that housing prices continue to increase but at a slowing pace. The 20-city price index advanced 10.8% year-over-year in April. This is down from a 12.4% increase in March and the index’s cyclical peak of 13.7% in November 2013. The sustainability of the housing rebound from the severe weather months will be tested as anticipated higher interest rates will translate into more expensive home loans.
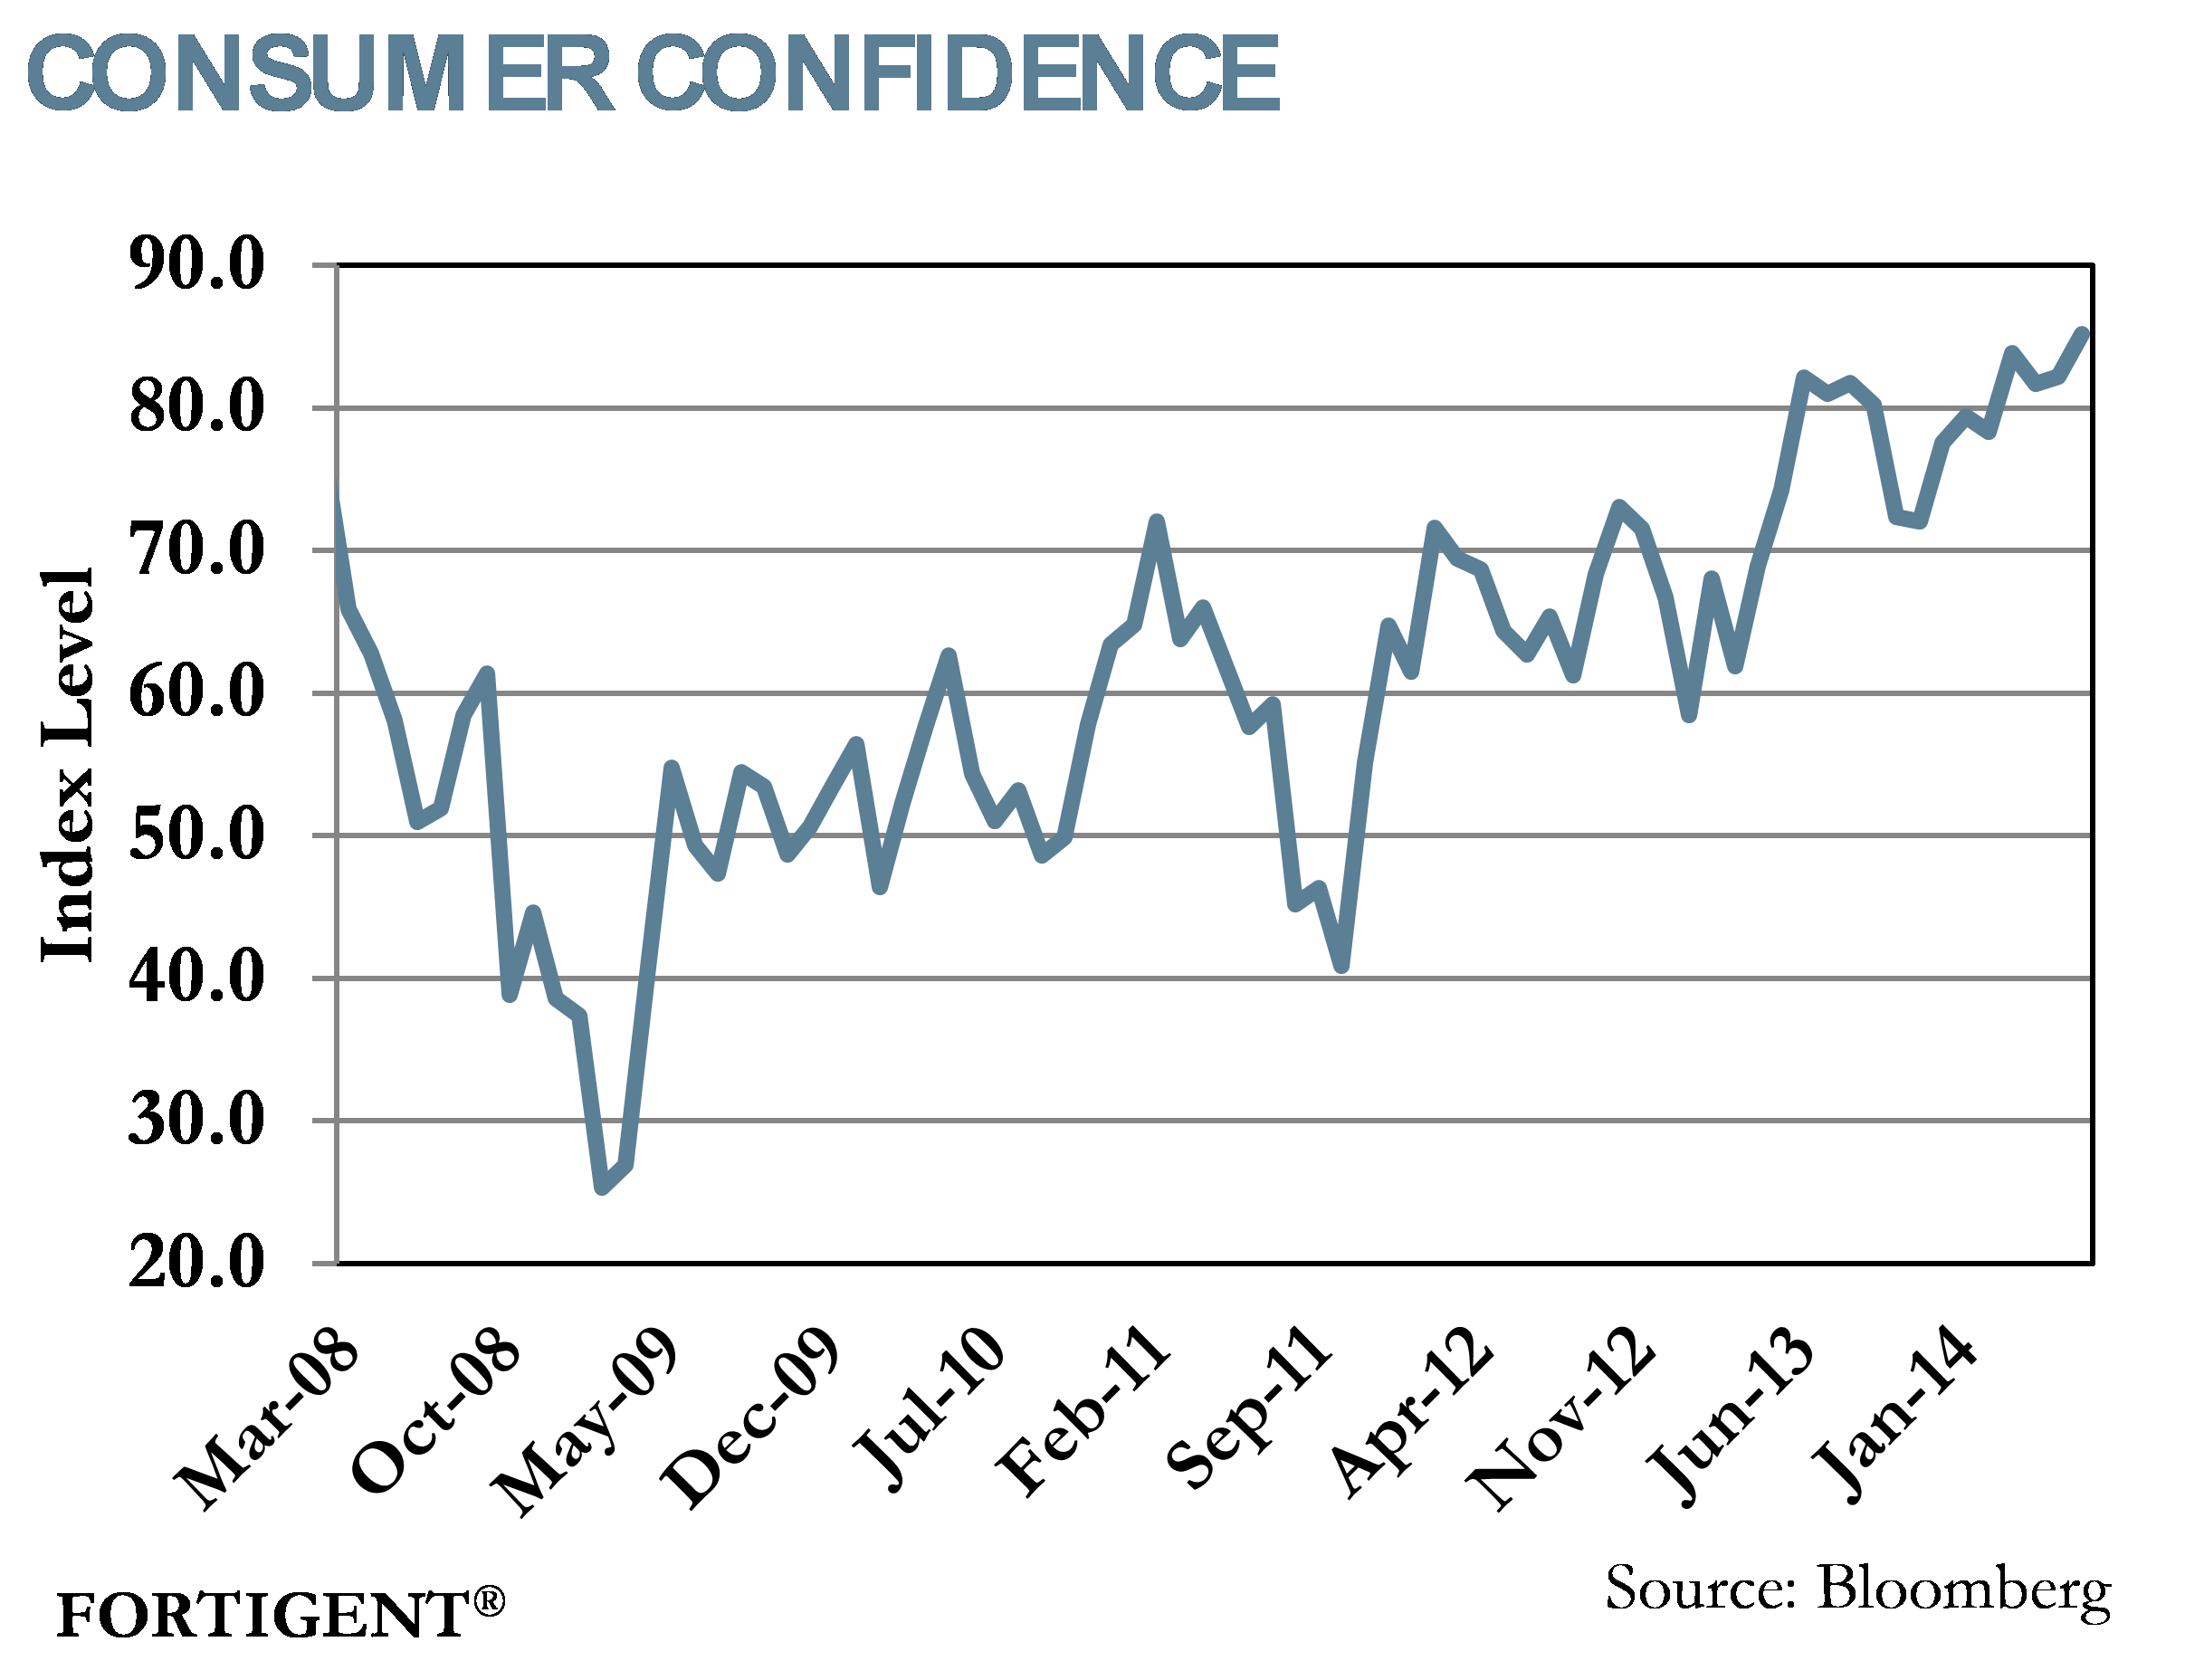
Consumer confidence remains a positive as the Consumer Confidence Index touched 85.2 in June. This is the highest reading since January 2008 as households have grown more optimistic about the labor market. The University of Michigan’s Consumer Sentiment Index followed suit, albeit at a slower pace, as the index increased 0.6% month-over-month.
Fixed Income Markets cruise – what’s next?
For the better part of twelve months, fixed income markets have been in a rather benign state. After receiving a scare in early summer 2013 during the “taper tantrum,” volatility subsided, and normalcy returned to the world of fixed income. As money continues to pour into fixed income markets, there is growing concern that the investment opportunity is stretched and the time to rebalance is now.
Recently released analysis from Barclays shows just how phenomenal the growth in fixed income markets has been. From December 2007 through March 2014, the US corporate credit index grew from $1.9 trillion to $3.5 trillion.
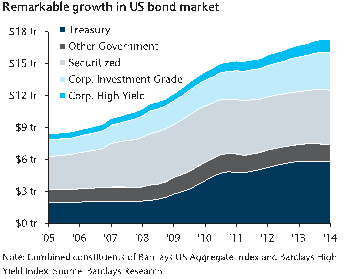
Source: Barclays Research
Accompanying the growth in size has been a very strong run of performance. Since August of last year, for example, high yield markets have risen in a nearly straight line with few hiccups along the way. The Barclays High Yield Index recently crossed $106, which means that with the typical bond maturing at $100, investors stand to lose $6. Yields are also dropping quickly, and the same index recently fell below a 5% yield-to-worst.
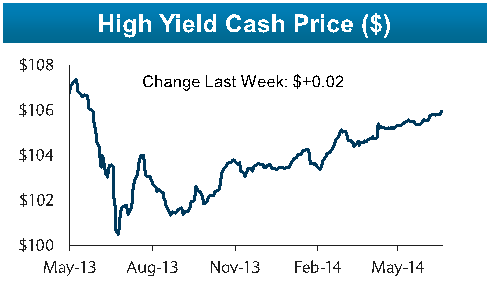
Source: Barclays Research
As prices rise and yields decline, investors are left wondering if it makes sense to allocate capital to fixed income markets. From an absolute value perspective, it is becoming quite difficult to justify the price. Outside high yield credit, investors are having to pinch their nose each time they buy investment-grade bonds, developed market sovereign debt, and certain segments of the securitized markets.
Europe has become another example of this phenomenon, where yields on Spanish and Italian government debt are now roughly equal to that of the U.S. The backstop provided by the European Central Bank is the primary reason for this convergence, but it is clear that the fiscal and economic situations in these countries remain worse than the domestic picture in the US.
Across the board, fixed income markets are pushing on a string, accepting ever-lower yields at the expense of increased future risks. Interest rate volatility is near historically low levels, but recent economic data suggests the Federal Reserve will be moving towards the exits, which could reintroduce volatility to fixed income and unnerve recently sanguine markets.
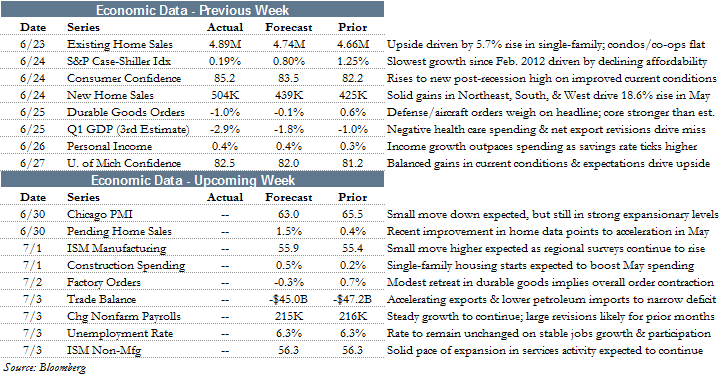
the week ahead
This week is ripe with economic data as the quarter draws to a close. Both ISM manufacturing and service indices are slated to come out. Pending home sales and trade balance data will provide more color around the latest GDP figure. The shortened week wraps up with the release of the June unemployment rate.
Central bank policy announcements are due this week from Australia, Poland, Sweden, and the Euro Area.
About Fortigent
Fortigent, LLC delivers a fully integrated and customizable business-to-business outsourced wealth management solution to banks, trust companies, and independent advisory firms. Services include a comprehensive investment platform with particular expertise in alternative investments, a flexible unified managed account program, and consolidated wealth reporting. Fortigent's web-based portal interface allows access to proposal and rebalancing tools, client portfolio reporting and accounting, as well as industry articles, research papers, and other practice management and business development resources.
The information provided is general in nature and is not intended to be, and should not be construed as, investment, legal or tax advice. Fortigent makes no warranties with regard to the information or results obtained by its use and disclaims any liability arising out of your use of, or reliance on, the information. The information is subject to change and, although based upon information that Fortigent considers reliable, is not guaranteed as to accuracy or completeness.
Not FDIC Insured No Bank Guarantee May Lose Value


