Dear DCCM Clients and Friends,
Since our last investment letter, the S&P 500 has continued to rally, albeit with a 6% dip in late January ostensibly caused by extremely cold temperatures and tensions in the Ukraine. And bond markets regained their footing after a selloff last Summer associated with FED tapering. As the quote from Chaucer states, however, we believe the current stock bull market that began on March 9, 2009 is in the later stages of its current cycle. We don’t believe that a bear market is imminent, but do think that it is time to start asking the question when one will start. While this statement may come as a surprise to some, it is at times of strong and improving financial confidence (i.e. at the top of previous bull markets in 2000 and 2007) that bear markets often start emerging from hibernation. And near the top, there are typically few naysayers. To point, the British biologist J.B.S. Haldane noted that ideas tend to experience 4 stages of acceptance: 1) worthless nonsense; 2) interesting; 3) true, but quite unimportant; and 4) I always said so. Based on the immense amount of research that we read, we would say that the idea of a significant decline in stocks anytime in the next few years is currently considered “worthless nonsense” to most people. To us, this is a promising sign that we are on the right track, as the consensus view is, by definition, wrong at market inflection points (i.e. the top of bull markets and the bottom of bear markets).
There are literally thousands of data series that an investment manager can track in order to determine economic and stock market cycles. And over our 20+ years in the investment business in the roles of banker, expert witness, stock analyst, and portfolio manager, we have gradually narrowed our focus to those that have long track records of accurately predicting recessions and bear market with few or no false positives. In investment parlance, these are called leading indicators because the data changes prior to the economy contracting or stock prices declining. We have found coincident indicators to also be useful as a confirmation of the change in trend. In this and future letters we will explore such indicators, but before getting started let’s take a look at various significant declines in the S&P 500 since WWII ended about 70 years ago and the subsequent bull markets. Importantly, the media refers to declines of 10% as a “correction” and 20% as a “bear market”. However, we have found more natural breakpoints occurring at declines of 15%, 25%, and 35%. And since we are most concerned with significant declines, we have left off the many that were less than 15%. Note that we use total return data for the S&P 500, which accurately includes reinvested dividends, whereas the vast majority of media incorrectly exclude the dividend component when dating corrections and bear markets.
Table 1: S&P 500 Significant Declines Since WWII
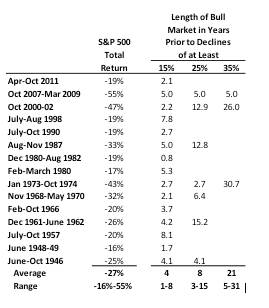
A few observations about the Table 1 data: 1) declines of at least 15% occur fairly frequently, with an average of about 4 years in between; 2) declines of at least 25% are less common, but still occur about every 8 years on average; and 3) major declines of at least 35% are pretty rare, occurring an average of 21 years apart. While this data is informative about the depth and frequency of significant declines in the S&P 500, it is not very good at predicting the timing of such events. For example, while the average length of bull markets after declines of at least 15% is 4 years, the range is very wide at 1-8 years. And the disparity of the range around the average increases as the declines get bigger. Accordingly, the fact that we are currently about 2 ½ years since the end of the last decline that exceeded 15% and a little over 5 years from declines that exceeded 25% and 35% doesn’t tell us all that much about the timing of the next ones. So, we are in need of better metrics to predict the timing of cycles. And importantly, such metrics need to be based on logic and rationale rather than the random results of some statistic. For example, there is actually something called the Sports Illustrated Swimsuit Issue Stock Market Indicator (I am not making this up). Basically, it looks at historical returns of the S&P 500 and has found that in years that an American woman is on the cover of the magazine, the S&P 500 does better on average than in years that a non-American woman is on the cover. Suffice it to say, this is not one of the indicators that we pay attention to. And in our opinion, this is the worst kind of data mining because it looks at two different sets of data that have no relevance to each other and tries to draw conclusions about the results (i.e. it tries to make the case that correlation is causation). Accordingly, when finding data that appears to predict economic and financial cycles, it is paramount to establish a causal link to reduce the likelihood that it is simply chance, which has no predictive power.
The metrics we follow fall into nine categories: valuation, credit, inflation, sentiment/confidence, corporate profits, economy, employment, portfolio management, and stock trading. In this letter, we will discuss the first of these, with the remaining ones to be tackled in future missives.
Valuation
Through our extensive research, we have found that there is no better predictor of future long-term returns than the current valuation of the security being purchased. So, what is valuation? The current yield of 10 year U.S. treasury bonds is about 2.5%. The inverse of this figure is 40. So, those that purchase this bond today are essentially paying 40x one year’s worth of interest. The corollary for stocks is the price to earnings ratio, which is the current stock price divided by some measure of annual earnings per share or EPS. So, all else being equal, it makes sense that buying a stock with a lower P/E ratio or multiple today would lead to higher future returns because you are getting more EPS for each dollar you spend (i.e. you receive a higher earnings yield, which is the inverse of the P/E ratio). Importantly, there are many different ways to calculate EPS: trailing 12 month, projected 12 month, annual average of the trailing 10 years, inflation adjusted, GAAP earnings, operating earnings, etc. All of these methods have pros and cons, which is why we choose to use several of them rather than just one. Further, we utilize several methods that don’t include earnings as well.
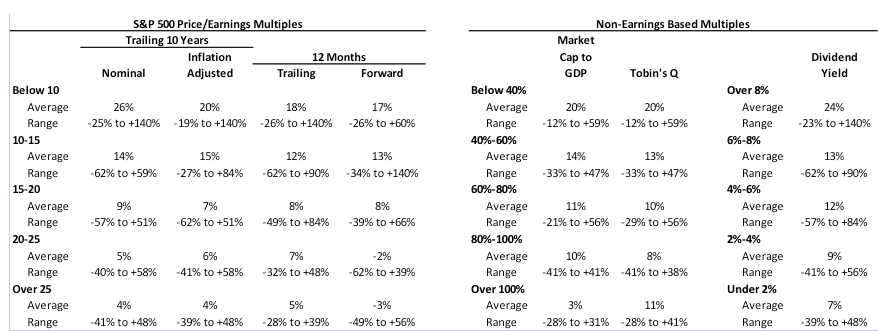
In Table 2, we illustrate future 1 year returns since 1871 if you had purchased the S&P 500 under different conditions. For example, when the trailing 12 month P/E ratio on the S&P 500 was below 10 at the time of purchase, future 1 year returns have averaged 18%. As you can see from the data, higher multiples and lower dividend yields almost always result in lower future returns. However, the large ranges of returns imply that these valuation techniques are not very accurate at predicting short term performance. For example, if you had purchased the S&P 500 when it was trading below 10x average trailing 10 year nominal EPS, your future return could have been as low as -25% to as high as +140%.
Table 2: 1 Year Future Returns Since 1871
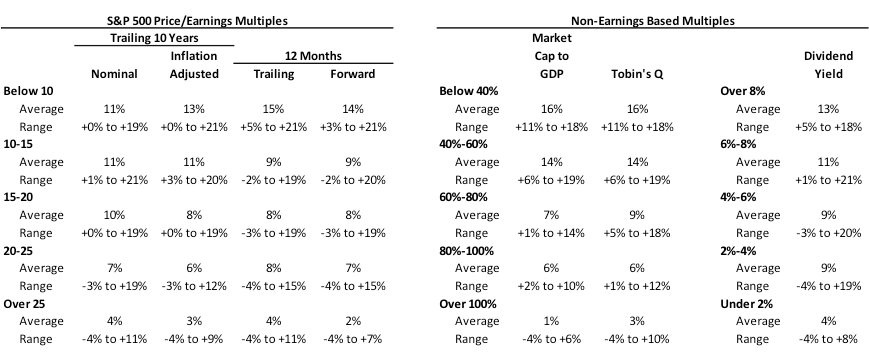
In Table 3, we present that same methodology except that the returns are annualized over the following 10 years. What you find is that purchases made at higher multiples and lower dividend yields continue to result in lower returns on average, but the ranges are much smaller, implying better predictive power. In short, these valuation metrics are very good at predicting long term rather than short term performance.
Table 3: 10 Year Annualized Future Returns Since 1871
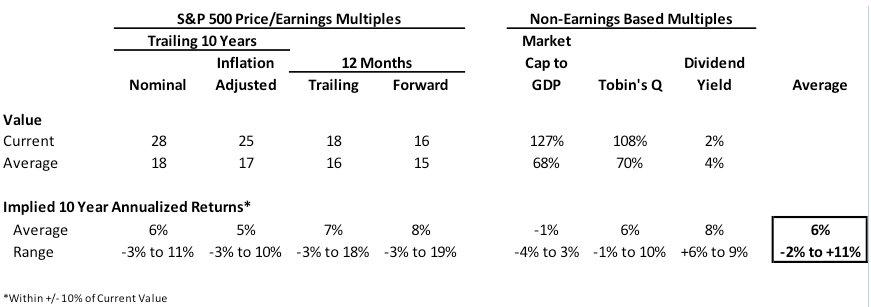
So, where do we stand today? In Table 4, we illustrate current and average multiples, and implied 10 year future returns. As you can see, all 7 metrics show that the SP 500 is overvalued and that future returns under current conditions have been below the S&P 500’s long-term compound annualized return of about 10%. And keep in mind that the disparity compounds over time, so achieving a 6% annual return instead of 10% results in total returns over 10 years of just 79% vs. 159%, respectively. Further, be wary of averages because the low end of most of the ranges is negative. In essence, don’t forget the allegory of the 6 foot man who drowned in the river that’s five feet deep, on average. On the flip side, as the high end of the ranges shows, it’s not that you can’t achieve 10%+ annual returns starting at current valuations, but the probably is fairly low. And while the S&P 500 may not look that overvalued based on the Forward 12 Months multiple, keep in mind that the earnings in the denominator are based on actual earnings looking backward after the fact. In reality, stock analysts tend to overestimate earnings, particularly near the top of bull markets, so in a few years we may look back and realize that the 12 months forward multiple was actually above 20x today.
Table 4: Current Multiples and Implied 10 Year Future Returns
So far in this letter, our valuation analysis has focused exclusively on the S&P 500, which we believe is a good representation of large cap U.S. stocks. However, we have recently seen overvaluation in other areas as well, particularly technology, that are reminiscent of the tech bubble in the late 1990s:
· Airbnb: recently raised money at a $10 billion valuation on $250 million in revenue for a revenue multiple of 40x
· Dropbox: recently raised money at a $10 billion valuation on just $200 million in revenue, for a revenue multiple of 50x
· Whatsapp: purchased by Facebook for $19 billion on reportedly less than $100 million in revenue for a revenue multiple of at least 190x
· Pinterest: recently raised money at a $5 billion valuation and reportedly has little revenue
· Snapchat: reportedly turned down a $3 billion offer from Facebook and supposedly doesn’t even have any revenue!
· Bitcoin: the current price is about $500, although it is so volatile that it could be up or down 50% by the time you read this letter; given that it is a virtual currency not backed by any government (i.e. the largest bitcoin exchange in the world called Mt. Gox was recently hacked and nearly $500 million worth of bitcoin vanished into thin air), we would assign it a value of $0, give or take a few pennies
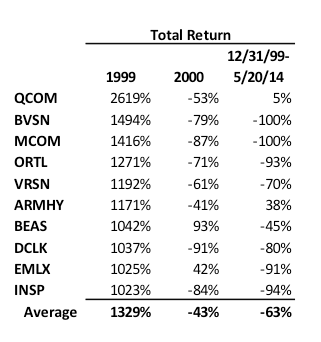
Further, the percentage of IPOs that have negative earnings (i.e. about 75%) is almost as high as it was in early 2000 at the top of the tech bubble. And while it may be tempting to trade expensive tech stocks and buy their IPOs, the cost of getting the timing wrong can be painful. Good friend and long-time portfolio manager Brad Williams recently sent me the data in Table 5, which shows returns for the best performing stocks of 1999 along with their performance in 2000 and since 1999. Even more than 14 years later, the vast majority of them are still down huge.
Table 5: Best Performing Stocks of 1999 and Subsequent Performance
Conclusion
So, what does all this mean for your money? Well, it strongly argues against buy and hold, which we have never been a proponent of. As we illustrated, long term returns are driven by the valuation of stocks at the time of purchase. So, we don’t aggressively buy stocks at all times and hold them forever. To the contrary, because we are long-term value investors and stocks are currently overvalued, we will likely be reducing risk going forward if stock prices continue to rise faster than earnings. Why not become very conservative now? Because historically, overvaluation by itself has not been enough to produce significant stock market declines, although the degree of overvaluation does correlate to the severity of the bear market. Rather, there is usually a catalyst involved such as FED action, oil shock, inflation spike, major bank going bankrupt, etc. that occurs near the inflection point. In short, stocks can continue to become even more overvalued before falling significantly, just like they did in the late 1990s and 2006-07. And that is why shorting stocks near the top of bull markets is difficult and risky. In the words of economist John Maynard Keynes, “the market can stay irrational longer than you can stay solvent.”
As mentioned previously, we do not expect a significant decline in stock prices in the near future, but do believe it is likely to happen within the next few years. And because we are focused on producing strong risk-adjusted returns over full market cycles rather than trying to beat an arbitrary benchmark over short periods of time, we are much more focused on reducing downside in the next bear market than trying to capture all of the remaining upside in the current bull. In summary, we are focused on winning the race, not the furlong. Horse racing enthusiasts will note that California Chrome didn’t take the lead in the Kentucky Derby or the Preakness Stakes until the last turn, but is now poised to become the first Triple Crown winner since Affirmed in 1978. And in fact, our research has shown that the best performing investment managers at the top of bull markets are often the worst performers in bear markets and the worst risk-adjusted performers over full market cycles. Why are we so focused on risk management? Because we have seen time and time again investors selling stocks and going to cash at the exact wrong time (i.e. at the bottom of bear markets) either because they can’t stand the psychological pain or because they have an unexpected financial need (i.e. lost job, medical bills, divorce, etc.). We call this a permanent impairment of capital. How do you avoid this trap? Don’t get killed in the next bear market even if it means giving up a little bit of upside at the end of the previous bull market. This strategy has served us well in the past when we reduced risk in the Summer of 2008 and the Summer of 2011, both just before significant stock market declines.
In future letters, we will discuss a number of shorter term metrics we use to predict such cycles. They are not screaming sell just yet, but we are monitoring them closely.
If you believe that your friends or family would benefit from our investment letters, please feel free to pass them along or shoot us an email and we’ll put you on our distribution list. And keep in mind that we offer free, no obligation portfolio reviews for our investment management and financial planning services.
Thank you for your continued confidence and please call or email with questions anytime,
Sean Butson, CFA
President
DC Capital Management LLC
Phone: 970-468-1339
Email: [email protected]
All comments in this letter are strictly the opinions of the writer and in no way should be construed as guaranteed. Opinions expressed are subject to change without notice and, due to the rapidly changing nature of capital markets, may quickly become outdated. The opinions and information presented do not constitute a solicitation for the purchase or sale of any securities or options on securities. Please contact DC Capital Management if there are any changes in your financial situation or investment objectives, or if you wish to impose, add or modify any restrictions to the management of your account. Our current disclosure statement is set forth on Part II of Form ADV and is available for your review upon request.