|
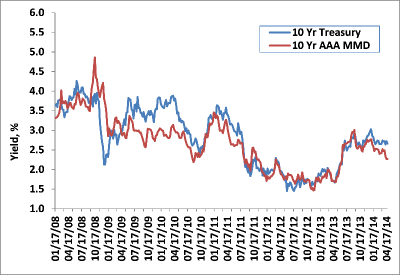
With the crisis in Ukraine escalating, US Treasury yields were able to grind marginally lower last week, despite improving economic data pointing to gradually improving fundamentals. At a yield of 2.67%, 10 year Treasury rates have been confined to a 25 basis point trading range over the last 12 weeks (2.57%- 2.82%), which according to Bloomberg, is the narrowest such range in the last two decades. However, broader interest rate trends could soon reemerge despite this recent complacency, as the spring suggests stronger economic data following an exceptionally poor winter—breaking Treasury yields from its unsustainable, narrow range.
This week offers a great deal of new information, all of which has the ability to drive market volatility and shape interest rate direction for the next several weeks. The key data releases include: Q1 GDP, ADP jobs report, the FOMC on Wednesday, consumer confidence, and the employment report on Friday. With yields at their lowest levels since last June, the payrolls report will command the most attention. Expectations are that +215k jobs were created in April, with the unemployment rate inching lower to +6.6%.
|
|
|

|
|
Weekly Change: 10Y Treasury Yields vs.
10Y AAA MMD
Source: Bloomberg, Thomson Reuters and Castleton Partners
|
|
|
|
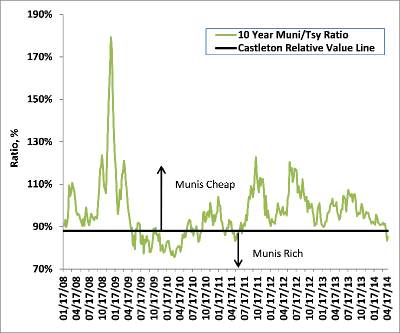
Ratio of 10Y Muni Yield to 10Y Treasury Yield
Source: Bloomberg, Thomson Reuters and Castleton Partners
|
|
|
Tax-Exempt
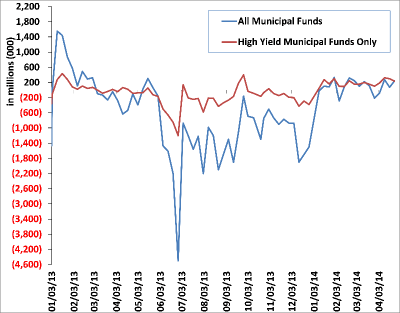
Finding support in a firm Treasury market and pent up demand from returning mutual fund investors, the municipal market was able to absorb nearly $8 billion of new supply last week. With total returns approaching 5% so far in 2014, the tax exempt market is on pace to begin the year with four consecutive monthly gains for the first time since 1991. Despite 10 year yields falling to 2.28%, $233 million of new money was invested in municipal bond funds last week—no doubt, driven by recent tax filings reminding investors of the new, higher marginal tax brackets that went into effect in 2013. As a reminder, top wage earners now face a marginal tax rate of 39.6%, plus an additional 3.8% tax on all unearned income except tax exempt income. As Congress returns from its two week recess, and mid-term elections increasingly taking focus, we view any potential reduction in the value of the tax exemption of municipal interest unlikely in 2014.
Tax exempt supply is expected to be approximately $5 billion this week. Following a recent trend of increased issuance by high profile universities, Stanford University (Aaa) is expected to price a new $300 million loan. Other notable and large deals include an $834 million Pennsylvania general obligation loan (Aa2) and a $320 million Virginia College Builder deal.
|
|
|
|
|
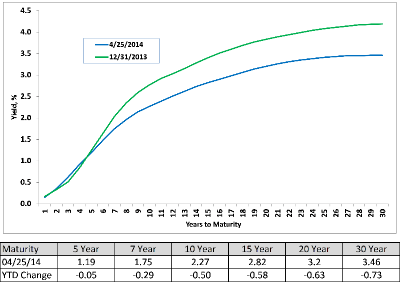
AAA Municipal Market Data (MMD) Yield Curve
Source: Thomson Reuters
|
|
|
|
Weekly Municipal Mutual Fund Flow Data
Source: Lipper AMG Data
|
|
|
Taxable
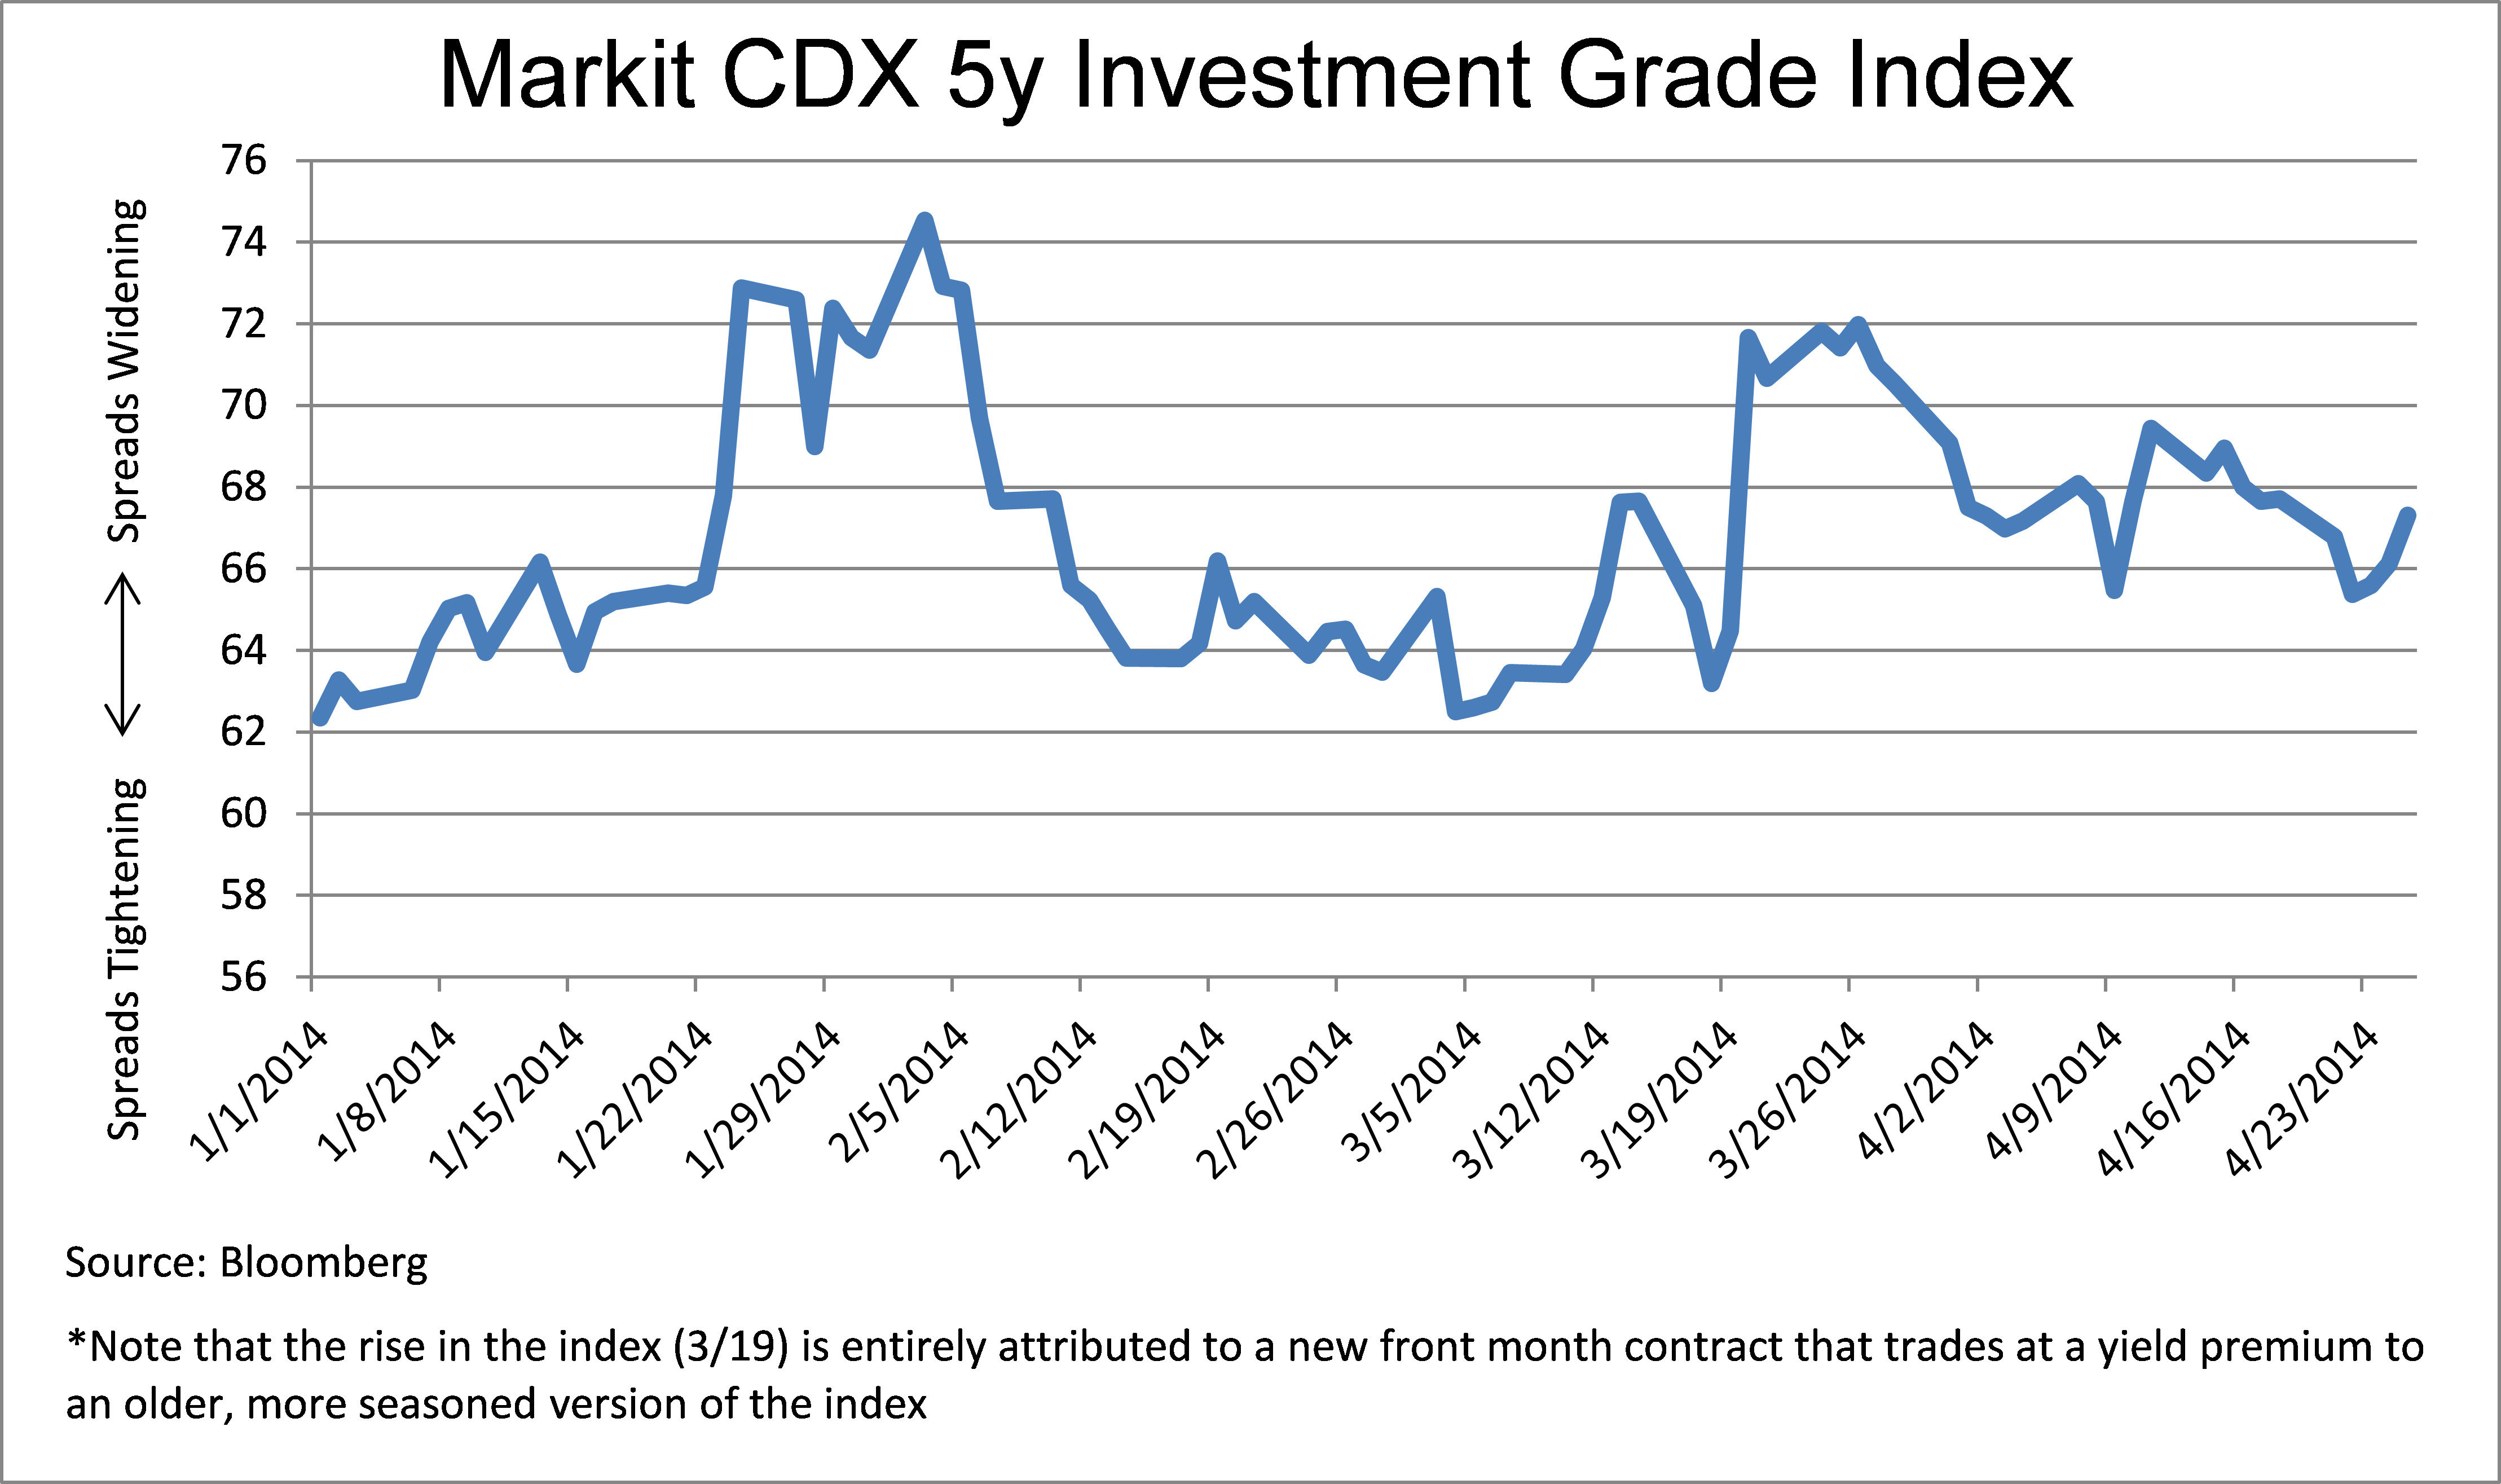
Investment grade spreads were largely unchanged last week, as heavy new issuance,—especially in financials—set the tone. With spreads remaining at post financial crisis tights, we remain cautious on corporates, believing that narrow spreads, combined with generational low yields, leaves little room for any material improvement from current levels.
With over $93 billion priced month to date, April issuance is expected to top $100 billion, the fourth consecutive month to do so. Looking to take advantage of a flattening yield curve and interest rates at 10 month lows, corporations have opted to issue debt further out the maturity spectrum, notably 10 years and 30 years.
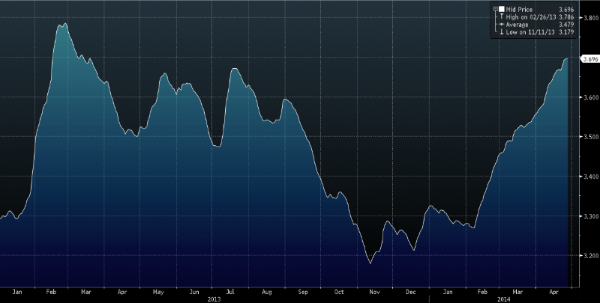
Chart of the Week
At $3.70 a gallon, unleaded gasoline is at it's highest level since March 2013 according to the American Automobile Association. This figure represents a $0.43 dent increase over the last 2.5 months… (Source: Bloomberg)
|
|
|
© 2014 Castleton Partners, LLC. All rights reserved.
THE FOLLOWING NOTES AND DISCLOSURES ARE AN INTEGRAL PART OF THIS REPORT: Past performance is not a guarantee of future results. Different investments involve varying degrees of risk, including the risk of illiquidity and the risk that you could lose part or all of your investment. There can be no assurance that the future performance of any specific investment, investment strategy, or product (including those discussed herein or recommended or undertaken by Castleton Partners, LLC) will be profitable, equal any corresponding indicated historical performance, be suitable for your portfolio or individual situation, or prove successful. Charts, graphs and indices are included herein only for reference and do not constitute forecasts of the past or predicted future performance of any investment. Indices are not investments. Due to changing market conditions and other factors the content herein may no longer reflect Castleton Partners, LLC’s current opinions or positions. Nothing discussed herein is or is intended as tax, legal, accounting or personalized investment advice from Castleton Partners, LLC. Should you have any questions regarding the applicability of any specific issue discussed herein we encourage you to consult competent advisers of your choosing. Nothing herein is or is intended as an offer to sell or a solicitation of offers to buy any security. Castleton Partners, LLC’s current written disclosure statement including discussion of our advisory services and fees is available upon request.
|
Read more commentaries by Castleton Partners