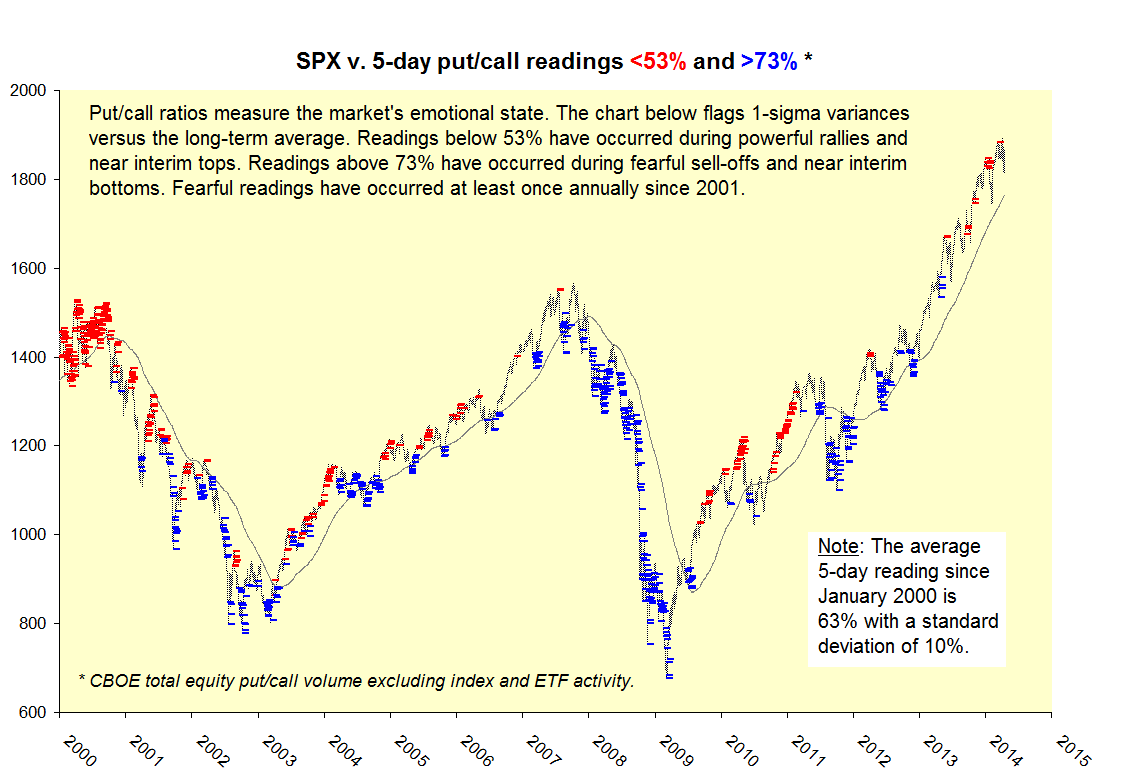
Equity put/call ratios provide an interesting lens on greed and fear. The chart below presents the S&P 500 since January 2000, flagging 5-day put/call ratios in excess of one standard deviation versus the long-term average of 63%. Readings below 53% have occurred during powerful rallies and near interim tops. Readings above 73% have occurred during fearful sell-offs and near interim bottoms. Fearful readings have occurred at least once annually since 2001 with the latest example in April 2013. The current reading as of 4/11/14 was a very mild 61%, matching that of the recent bottom on 2/5/14.
So, what’s wrong with this picture? Nothing, really. Markets go up on greed and down on fear. It’s the prolonged absence of fear that frightens me.