Did you ever try to run backwards? I find walking backwards difficult enough. Running in reverse can send you tumbling.
Yet that’s the exercise that various hot sectors of the US stock market engaged in last week. After soaring during the first part of the week, even the broad indexes fell dramatically on Thursday and continued falling on Friday. So far today, we’ve had a nice rally, but is it just a so-called dead cat bounce?
2013 was a great year for stocks. Just check out your twelve-month returns on your statements that are going out this week. While returns in the calendar year were excellent, breakeven to moderate gains or losses were the result for 2014’s first quarter.
As we have been discussing since December, stocks got a bit ahead of themselves with better than 30% returns in 2013. We predicted a retrenchment, accompanied by greater volatility. Of course this has come to pass. Look at the daily price changes so far in April, for example, and count the number of times each index registered a gain or loss of more than 1%:
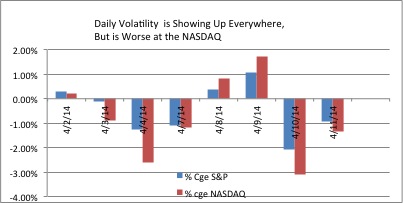
Source: Flexible Plan Investments
That’s volatility!
As of the end of last week, the average S&P 500 stock was down more than 10% since its recent highpoint, while the broader-based S&P 1500 stock (which includes mid caps and small caps) was down over 14%. Even poorer are the sector indexes, where losses are approaching the 20% bear market mark.
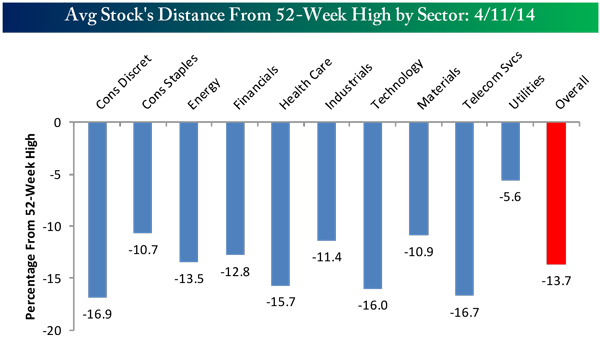
Source: Bespoke Investment Group
So far, the worst of the lot have been biotech and Internet/social network stocks. Their charts look positively horrid:
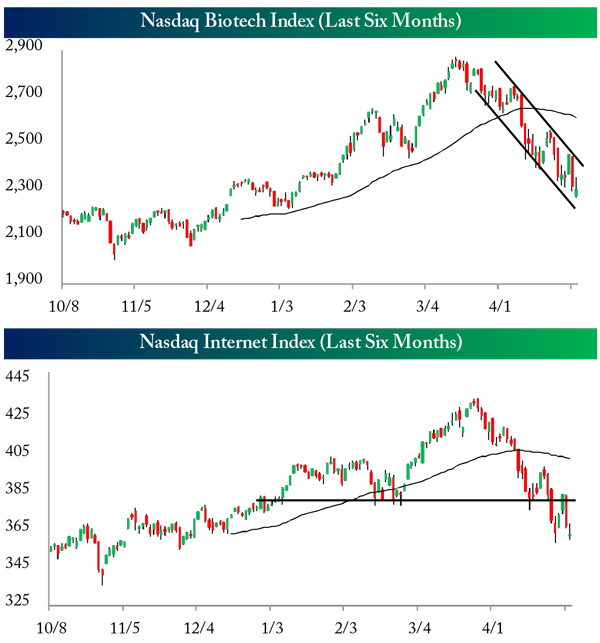
Source: Bespoke Investment Group
What’s this got to do with running backwards, you might ask?
I’ve pointed out many times in the past that the value of stock prices or index levels are a function of two numbers: the earnings per share and the earnings multiple. Both fluctuate; the former on the basis of the companies’ profitability and the second based on the market environment or psychology.
Earnings have been trending up nicely since the market bottomed five years ago. The growth has been remarkable, and on the S&P 500, for example, the average earnings per share are the highest ever!
The earnings multiple has been trending higher as well. For the S&P 500 it now averages better than 17 times. But there’s the rub – the average multiplier is about 14.
While the multiplier has been much higher at times in our history, when everything has been averaged out, it has usually been lower. If it moves lower at a faster rate than earnings rise, the indexes or the stock falls.
Most of the losses so far have been in the stocks with the highest multiple (P/E ratio):
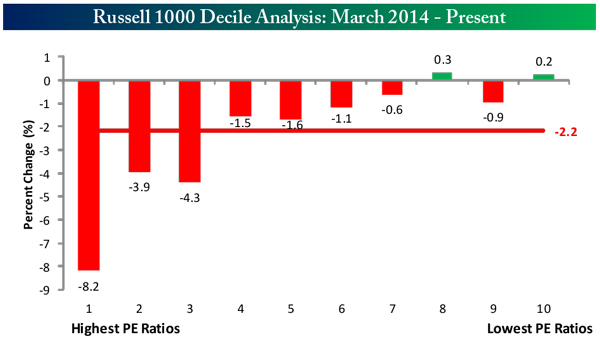
Source: Bespoke Investment Group
Note, the average P/E ratio for the Russell 1000 stocks is just 2.2!
Currently on Wall Street there is a bit of a quandary over whether the earnings portion will keep rising this quarter (earnings reporting started last week). Because of the severe weather over much of the United States this winter, it is feared that earnings may not have continued their upward progression and may have actually paused or reversed their rise.
If that happens, both earnings and multiples may run in reverse and the market will continue to tumble.
Reading the tea leaves of the early reports suggest that this will not happen. Both the Alcoa and Citi Group earnings beat expectations. And today’s Retail Sales Report was explosive good news. Sales in March grew at their fastest rate in a year and a half. In fact, pretty much across the board, economic reports have been signaling that the winter may not have been as damaging as once thought. Last week, eight out of eleven reports were better than expected!
So my guess is that the earnings portion of the valuation equation will hold its own. It might not gain as much as past quarters, but it will more than meet expectations. It will keep running in the right direction.
Of course, that still leaves the multiples portion. I’m not so confident here. Psychology has been badly shaken by the volatility demonstrated in the charts above. As the chart shows, bearish sentiment continues to increase. Unfortunately, it is not yet at the levels where a rally usually commences (over 50).
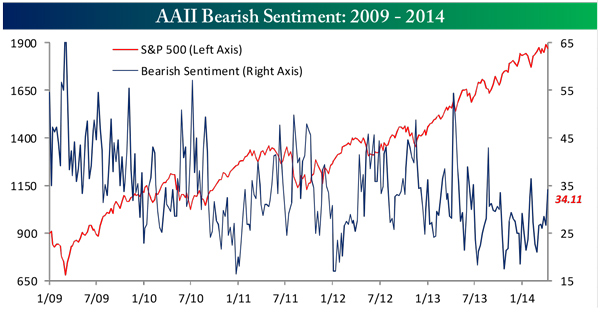
Source: Bespoke Investment Group
A reduction in the P/E ratio to reflect this investor caution could easily occur. And a continuation of the volatility mostly to the downside could continue. We could be running backwards on this part of the equation for a while longer.
Still, most of the losses have been confined to the sectors mentioned above, the tech issues and the smaller cap names. The S&P, for example, is down only 3.97% (as of Friday’s close) from its high point on April 2. And so far our indicators, while becoming ever more defensive, have not given up on this five-year-old bull market. Like me, they believe that stocks will move still higher, they just might have to run backwards for a spell to catch up after last year’s remarkable sprint.
All the best,
Jerry


