So, so you think you can tell
Heaven from Hell,
Blue skys from pain.
Can you tell a green field
From a cold steel rail?
A smile from a veil?
Do your think you can tell?
Pink Floyd, “Wish You Were Here”
In Brief:
•That the net worth of US households surged to a record $80.7 trillion in 2013 is impressive, but hardly relevant. Though net worth is a useful indicator of household financial fitness, its analytical value as a predictor of household spending is overrated.
•Households have made significant progress mending their balance sheet in the post-crisis period. Assets have been boosted on the back of higher home values and stock prices, while liabilities have been trimmed, mostly mortgages, thanks in large part to widespread home foreclosures.
•The restructuring of assets and liabilities is a long-term process and deleveraging has further to go. Against this backdrop and absent a spurt in employment and income, consumer spending will continue anemic, contributing to the economy’s subpar growth, by historical standards, of about 2% for the foreseeable future.
Feeling Better Off
The recently released report by the Federal Reserve on the growing wealth of US households was greeted as a promising sign that the economic expansion underway has long legs. Paced by a surge in stock prices and gains in home values, the net worth of households climbed by $9.8 trillion in 2013 to a record $80.7 trillion (Exhibit 1). The rise in net worth is also consistent with the Fed’s ultra-low interest rate policy aimed at energizing consumer spending through the wealth effect of asset price inflation.
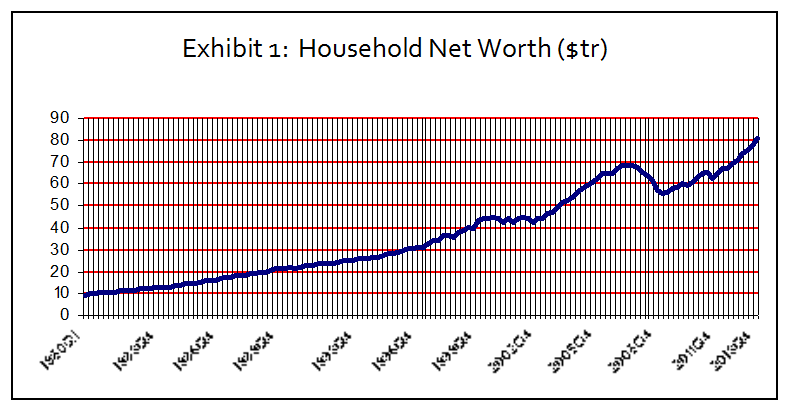
Source: FRB, Flow of Funds
Yet, despite the recovery in asset prices, the net worth of households as a percentage of disposable personal income still stands significantly below the previous peak in 2Q2007 (Exhibit 2). Absent a strong rise in personal income, households have a lot of digging out to do before they can afford significantly to step up spending, especially on housing.
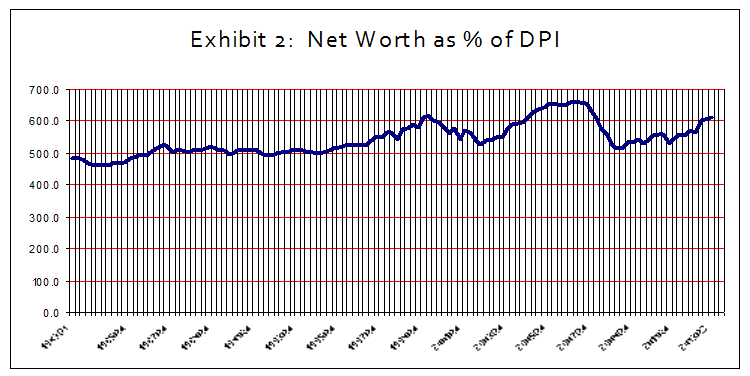
Source: FRB, Flow of Funds
Net worth is a useful indicator of financial fitness, but, like the personal savings rate and the federal budget deficit, its analytical value as a predictor of household spending is overrated. Essentially, it is an accounting residual, the result of changes in assets and liabilities. Much depends on the drivers of net worth on both the asset and the liability side of the balance sheet.
Source: FRB, Flow of Funds
Wealth in Homeownership
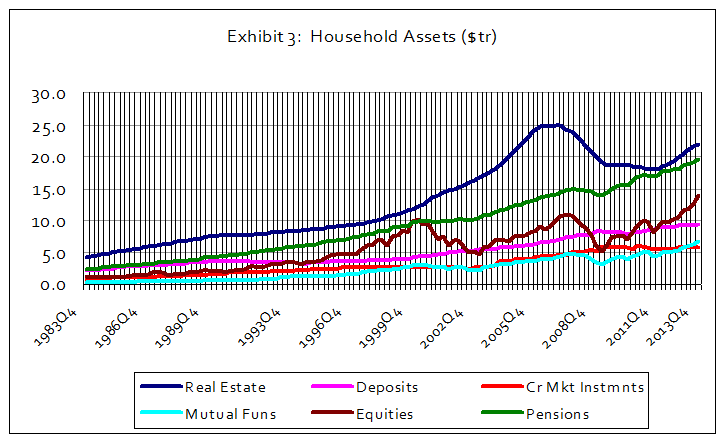
Real estate is the largest component of household assets, accounting for $22 trillion, or 23.3% of total assets at the end of 2013 (Exhibit 3). Despite a $2.3 trillion jump last year following the rise in home values, real estate has a long ways to go before reaching the bubble heights of the mid-2000s. Though home values will continue to recover, it is unlikely that homes in the foreseeable future will acquire the ATM status that drove so much of the consumer-spending spree during the 2001-2006 period.
Much of the rebound in home prices in recent years has been the result of aggressive buying by institutional investors eager to take advantage of rising rents. By comparison, households have been struggling to repair balance sheets laden with debt.
Source: FRB, Flow of Funds
Homeownership, which had dropped to an 18-year low of 65.2% at the end of 2013, is likely to be held back, especially for first-time buyers, by worsening house affordability. Having hit a record high in 2012, housing has become less affordable as a result of rising home prices, the jump in mortgage rates last year, and more stringent lending standards brought on by the Dodd-Frank legislation.
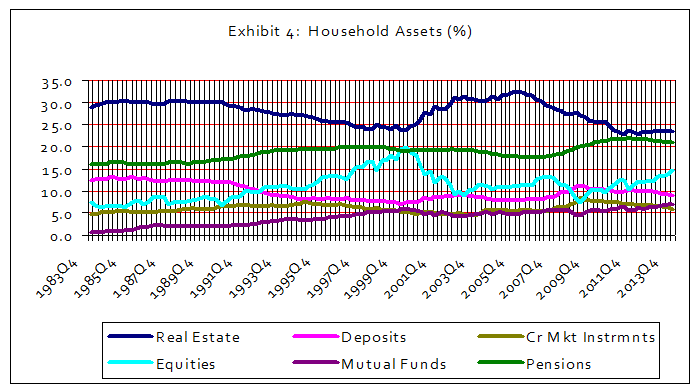
The depletion of home equity resulting from the collapse in home values is yet another factor keeping a lid on the ability by households to build up real estate wealth (Exhibit 4). Tougher loan-to-value requirements have made taking out new mortgages or refinancing of existing mortgages with cash take-outs more difficult. Though home equity has rebounded in recent years, it remains well below historical levels. It will take significant gains in home values before households regain the ability to spend more by leveraging the equity in their real estate holdings.
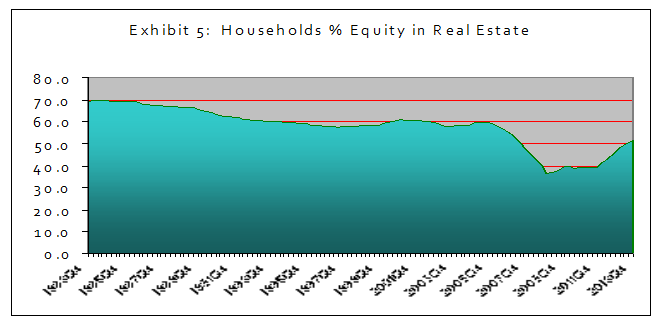
Source: FRB, Flow of Funds
Equity Holdings Rebound
Looking at the financial portfolio of households also suggests caution. Pensions and other types of retirement accounts at $19.6 trillion in 2013 are the largest component, amounting to 21% of total assets (Exhibit 4). Pension entitlements, however, are fixed and do not change in response to swings in asset prices. Beyond helping to shore up seriously underfunded pension levels for many private and state and local governments, asset price increases do not translate into stepped up spending.
The households’ equity holdings rose $3.7 trillion in 2013 to $13.9 trillion, a record (Exhibit 3). The jump in market value helped the equity portfolio regain all the ground lost during the 2008 financial crisis and then some. But at 14.7% of total household assets, the share of directly held equities failed to reach the previous peak of 19.8% at the end of the tech bubble in 1999 (Exhibit 4).
How much of this stock appreciation will translate into higher household spending is questionable. There are several factors at work that are likely to restrain household enthusiasm to spend. For one, stock ownership is disproportionately held by wealthier households. Though not immune to stock market cycles, they tend to hold their lifestyle fairly constant over time.
Also, it is estimated that about 40% of equities held by households are on the books of nonprofit organizations (this estimate provided by the FRB is about two years old, but most likely still holds true today). Nonprofits, like pension funds, do not alter spending patterns as a result of short-term swings in the stock market.
Lingering Risk Aversion?
Deep-seated risk aversion is yet another factor suggesting a muted spending response by households to the surge in the stock market. Last year’s largely unexpected rise translates into a hefty 22.3% annualized return for the five-year period ended in December 31, 2013, according to MSCI USA Index performance. For the five years ended December 31, 2012, however, using the same yardstick, stocks returned a puny 1.1%, and barely eked a 1.0% return during the “Lost Decade” 2001-2010.
The “return of capital” rather than the “return on capital” continues to drive asset allocation decisions. How else continuing inflows to fixed-income assets despite low interest rates be explained (Exhibit 6)? Net purchases of Treasuries, corporate and foreign bonds directly held by households increased by $803 billion from 20091Q to 2013Q4 (this is the sum of unadjusted quarterly figures and represents the value of transactions). By comparison, households whittled down their direct ownership of stocks by $1.1 trillion for the same period. This behavior runs contrary to popular view that Federal Reserve QE policies and artificially low interest rates are driving investors further out on the risk spectrum with equities having become the asset class of choice. That household stock portfolios have gone up in value during this period reflects higher prices rather than increased demand for stocks.
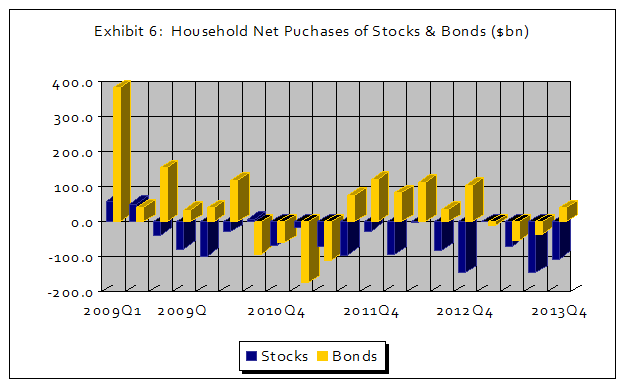
Source: FRB, Flow of Funds
Demographics also play a role, as aging baby boomers appear willing to forgo capital appreciation in favor of more secure fixed-income payments. Surveys show that in the aftermath of two horrendous bear markets (the 2001 dot-com bubble and the 2008 financial crisis) in the span of 10 years, willingness to take substantial investment risk has decline significantly, especially among older households (Exhibit 7). (The figures are dated 2012, but the overall picture most likely still holds today.)
Exhibit 7: Willingness to Take Substantial Investment Risk by Age Group
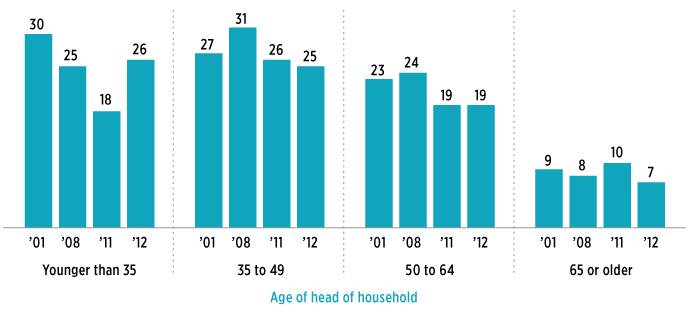
Source: Investment Company Institute, The 2013 Fact Book
Deleveraging
In the aftermath of the Great Recession, households have made substantial progress in deleveraging their liabilities. Total credit market debt fell $800bn from a record $13.9tr in 2008Q4 to $13.1 trillion in 2013Q4, mostly through a whopping $1.3 trillion reduction in home mortgages. In contrast, consumer credit rose $400 billion during this period. Similarly, the level of debt relative to personal income also fell significantly from a peak of 130% in 20074Q to 104% in 2013Q (Exhibit 8). The debt reduction, coupled with low interest rates, have made servicing the debt burden more affordable. (Debt service figures are soft and should be looked at only as indicative of trend.)
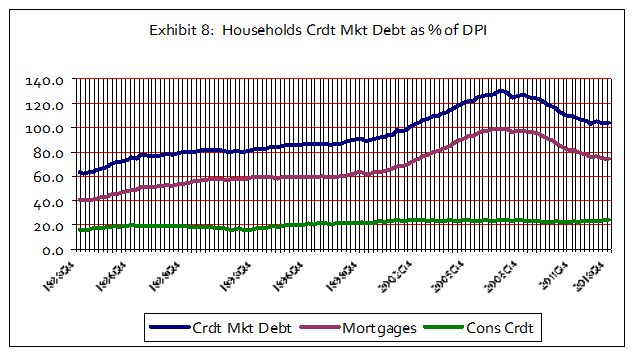
Source: FRB, Flow of Funds
Despite the deleveraging, households find it hard to boost consumption by stepping up the use of credit. A large portion of the decline in debt was involuntary, e.g., the result of large-scale defaults and foreclosures. From a historical perspective, overall debt levels are still high relative to income. Median household debt had increased from $60,000 in 2000 to $70,000 in 2011 (most recent estimates by the US Census Bureau), driven by a rise in secured debt (mostly mortgages and home equity loans). Older households experienced the largest increase in median debt. For those in the 55 to 64 age group, median debt rose by 64%, but more than doubled for households 65 and over during that period. Especially intriguing is the greater use of secured debt by households 65 years and over. Could it be that a weak investment and retirement income is forcing seniors to tap into their home equity to meet higher spending needs, including those of medical expenses? Though both secured and unsecured debt declined in the last couple of years, the figures likely still stand above the average for the period (Exhibit 9).
Exhibit 9: Median Debt of Households: 2000 to 2011 ($000)
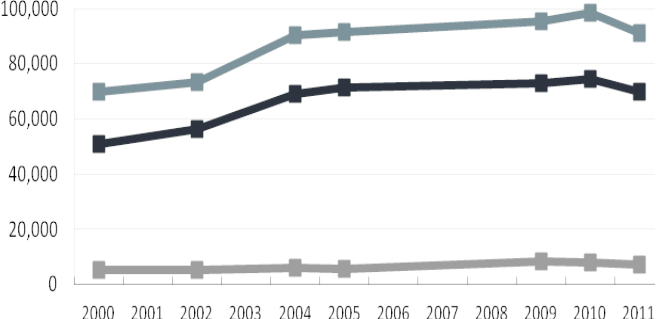
Source: U.S. Census Bureau, Survey of Income and Program Participation
The improvement in housing affordability has started to reverse thanks to higher interest rates and home prices. In addition, the jump in house prices in the last couple of years notwithstanding, wide swaths across the country with negative home equity make it difficult for households to increase spending by accessing credit. In the wake of new lending regulation, credit extensions have become tougher to come by. Among other things, interest-only loans have become largely extinct, while a slew of them taken out during the go-go years are now maturing and likely to add significantly to debt service payments.
The continuing rise in consumer credit in the post-crisis period is yet another example that household balance sheets are stressed. Though a far smaller part than mortgages, consumer credit, which includes student loans, auto loans and other forms of revolving credit, is an important budget item for less affluent households, requiring a significant portion of income for monthly payments. The growing burden of student loans on household budgets is well documented. With rising car prices ahead of growth in median incomes, many buyers would have been priced out of the new car market if it were not for the lengthening of auto loans to 6 – 7 years.
The Doubt of Appearances
The restructuring of balance sheets has improved significantly the financial profile of households. But the reported surge in wealth last year is mostly symbolic and lacks the horsepower to drive consumer spending. The rise in wealth is also highly concentrated amongst a small number of households, bypassing the vast majority of the middle class.
Beyond the immediate macroeconomic shortcomings of the rise in wealth lies the formidable challenge of household retirement. American households are greatly undermining their ability to save for retirement. For instance, estimates by the US Labor Department show that 55% of workers held no retirement coverage in 2010, and only about 30% were making use of deferred income plans like 401(k)s and IRAs, while those who save do not save enough. The median account balance for households 55-64 years was $120,000 in 2010, replacing just about 10% of the median household income. At the same time, the ongoing freezing of private defined benefit pension plans, coupled with reduced benefits for new employees by a growing number of public-sector plans, are likely further to undermine overall retirement income. Meanwhile, an increasing number of US households have come to depend heavily on their Social Security benefits to sustain their lifestyle in their “Golden Years.”
Disclaimer: This report was prepared by Dimitri Balatsos of Tesseract Partners and reflects the opinion of the author. It is confidential and proprietary. It is for information purposes only and is not intended to be used, and may not be used, as an investment or tax advice. No express or implied representation or warranty is being made with respect to its accuracy or completeness. It is based upon sources and data believed to be accurate and reliable. Opinions and forward-looking statements expressed are subject to change without notice. This report does not constitute a solicitation of an offer to buy or sell any security or investment products, or to provide investment advisory services.


