“Learn from yesterday, live for today, hope for tomorrow. The important thing is to not stop questioning.”
Albert Einstein (1879 - 1955)
The opportunity to visit with clients and prospects with exceptionally diverse backgrounds and personalities is one of the most interesting facets of our job. No two meetings are the same, and the thought-provoking discussions ensure that our profession never goes dull. Question topics range from broad market views to credit-specific details, with everything in between. In this newsletter, we address the questions that seem to be asked most frequently and/or we believe are particularly relevant in the current market environment.
The Top FAQs
- In your opinion, is the current high yield market compelling?
- Where are we in the business cycle?
- What is the outlook for defaults?
- Is the increase in low quality issuance a cause for concern?
- Are bank loans compelling in today’s environment?
In your opinion, is the current high yield market compelling?
Relative to history, high yield valuations are less attractive than average but high yield fundamentals are more attractive than average (technicals are average). Also, the forward yield curve provides some reason for caution. Our collective view on the high yield market, therefore, is positive but tempered.
Valuations
The current yield (coupon rate divided by the average price) of the high yield market1 as of 12/31/2013 was 7.1%, which is well below the long-term average of about 10%. Adjusted for the low interest rate environment, however, the current yield is in line with historical averages.
The current yield represents the income scheduled to be paid to bondholders. The actual amount paid to bondholders is less than this amount, however, due to bond defaults. This leads us to fundamentals.
Fundamentals
The default rate on the high yield bond market closed 2013 at 0.66%—well below the long-term average of approximately 4%2. Strong profitability, reasonable financial leverage, and extended debt maturities have combined to keep default rates benign. We have witnessed subtle signs of more aggressive issuance, however, and believe defaults will rise modestly but remain below long-term averages. If the default rate rose by 100 basis points and the post-default recovery rate remained at historical average levels (~40%), the amount of yield that investors actually received would decrease by about 1%.
Forward yield curve
According to the forward Treasury curve, the market expects the yield on similar-duration Treasuries to increase by about 80 basis points. Based on the duration of the high yield market and historical correlations, the amount of yield that investors receive would decline by another 1%, approximately.
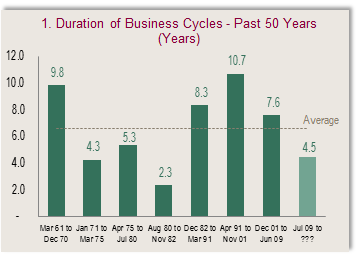
Where are we in the business cycle?
Chart 1 below highlights the duration of past business cycles as defined by the National Bureau of Economic Research. We are roughly four and a half years into the current business cycle, and the average contemporary business cycle has lasted between six and seven years. This would suggest we are about two-thirds of the way into the current cycle assuming the current cycle is of average duration.
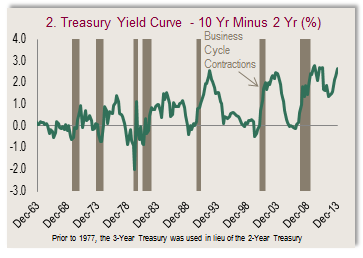
Not all business cycles are of average duration, however, so we search for signs of an inflection point. The shape of the yield curve has been a simple, yet powerful predictor of business cycles historically. As shown in Chart 2, each of the past seven contraction periods (dark grey periods) was preceded by an inverted yield curve. Today, the yield curve is steep, which provides us with a reason to believe that the end of the business cycle is not imminent in the near term.
In sum, if we reduce the current yield to compensate for default losses and rises in interest rates we would arrive at a rather modest figure. Default losses and interest rate changes are highly uncertain and not guaranteed, however, and could materialize in a considerably different fashion than the scenarios described above.
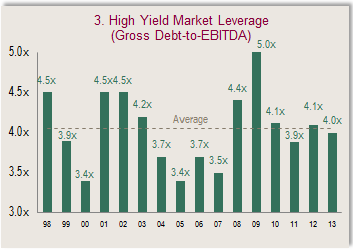
What is the outlook for defaults?
We believe the default rate will increase from the near-record low levels of 2013 but remain relatively benign. Historically, excessive financial leverage has preceded elevated default activity (e.g. 2008-2009). As shown in Chart 3, financial leverage is in line with the 15-year average.
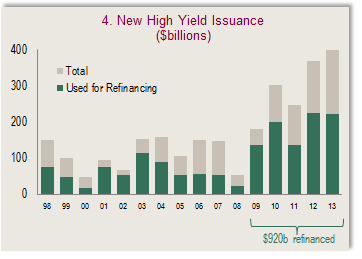
Robust new issuance over the past five years is the primary factor that should support the continuation of a subdued default rate environment. Chart 4 highlights new issuance in the high yield market over the past 15 years. Note the proliferation of new issuance over the past five years, which was driven by refinancing activity. In fact, $920 billion of high yield bonds have been refinanced over the past five years alone. For perspective, the size of the entire high yield market is approximately $1.6 trillion; i.e. nearly 60% of the market has been refinanced in the past five years.
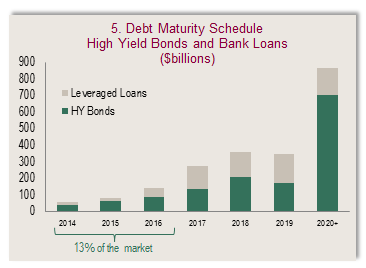
As a result of the unprecedented refinancing, maturity schedules have been extended. Chart 5 depicts the maturity schedule of the market for both high yield bonds and bank loans. A mere 13% of the market comes due in the next three years; more than half of the entire market is not scheduled to mature until 2019 or later. The absence of a so-called “maturity wall” in the upcoming years relieves the pressure on debt issuers to meet principal repayment obligations. This dynamic should also support a benign default rate environment.
Is the increase in low quality issuance a cause for concern?
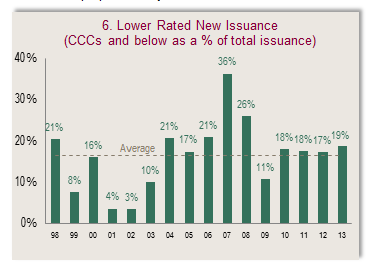
We are not overly concerned about the credit quality profile of the high yield market deteriorating. Lower rated (e.g. CCC-rated) new issuance volume has increased in recent years, but as we showed in Chart 4, total new issuance volume has increased. Chart 6 highlights that lower rated new issuance has not increased disproportionately.
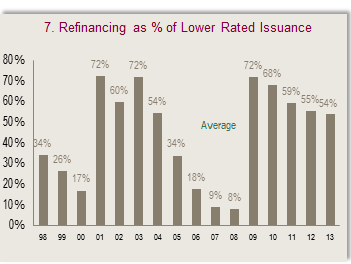
Also, most of the lower rated new issuance has been used for refinancing, as depicted in Chart 7. Swapping out a CCC-rated bond for another CCC-rated bond does not reduce the overall quality of the marketplace.
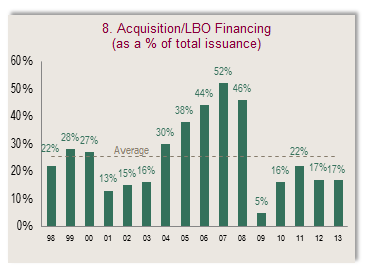
We have learned that an escalation in new issuance that is used for acquisitions/leveraged buyouts (“LBO”) serves as a better warning sign for credit deterioration. Chart 8 shows the percentage of new high yield issuance whose proceeds were used for an acquisition/LBO. This has remained in check thus far, but we would view an increase skeptically.
 \
\
Are bank loans compelling in today’s environment?
Select opportunities within the bank loan market may be interesting, but in aggregate, we are more optimistic regarding the prospects of the high yield bond market. First, let us compare valuations between the two markets.
Despite their prevalence, yield-to-worst and spread-to-worst are not appropriate metrics to use for comparing bonds and loans. A traditional high yield bond is structured with a series of call features that allows for early retirement of the bond. Typically, the calls are laddered in price and term, beginning halfway to maturity. At this point, the bond is callable at a price above par but that price ratably declines toward par as it approaches maturity. Investors accept this feature because the above par call price enhances the holding period return above the coupon rate. Companies like the callable structure because it affords them with financial flexibility. In contrast, a traditional bank loan is typically callable at par from the time of issue (although some loans have limited call protection in the form of a “soft call” provision).
We make this distinction because it has implications for the assessment of the relative value of bonds vs. loans. A simple comparison of yield-to-worst fails to capture important dynamics. In the case of bonds, investors benefit from the company’s inability to refinance the bonds at tighter spreads. This benefit accrues in the form of higher bond prices. Loans, due to their callable nature, generally do not experience material price appreciation.
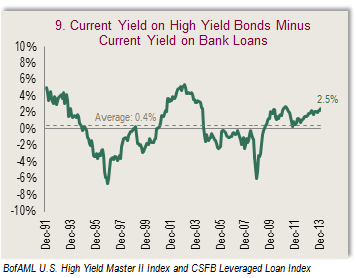
We believe current yield is a more suitable metric for comparing bonds and loans. Current yield is a proxy for what investors should earn over a relatively short period of time by investing in a bond or loan. As shown in Chart 9, bonds certainly appear to offer compelling value relative to loans.
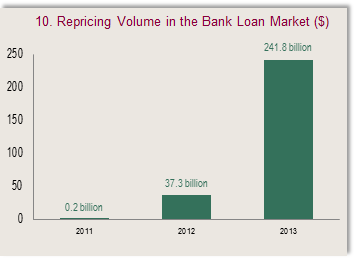
In addition to call uncertainty, a major problem with yield metrics in the bank loan market is repricing. A repricing occurs when the issuer threatens to call the loan (and typically refinance) unless the investor agrees to “reprice” the bond at a lower rate. This is different from a typical refinancing, where new terms are set and new investors are located. In a repricing, nothing changes other than the loan that used to pay LIBOR (London Interbank Offered Rate) plus 400 basis points, for example, now pays LIBOR plus 300 basis points. As shown in Chart 10, repricing is a rather new phenomenon. The reason investors have been willing to reprice loans is because demand has outpaced supply. The consequence for loan investors is lower yields. If repricing continues into 2014 (it has actually accelerated through the first two months), then the stated yield on the market is artificially inflated—some would say the stated yield is even theoretical, or simply fictitious.
Valuation is not the only reason we view bank loans cautiously, however. Several other factors give us pause:
1.The hedge against rising rates may be exaggerated ( particularly given the Fed’s policy stance )
2.Historical performance patterns
3.Loans appeal to short-term, leveraged investors
The hedge against rising rates may be exaggerated
Shifting from bonds to loans reduces interest sensitivity because loans have a lower duration. The challenge in the current environment is that bank loan coupons are stuck at low nominal levels. Until the Fed’s policy stance changes, the low interest rate environment will act as a performance drag relative to bonds, which have a considerably higher nominal coupon rate. Loans are priced at the front end of the yield curve whereas bonds are priced somewhere around the 5-year point of the yield curve (on average). When the yield curve is steep, like it is currently, the disparity between short-term rates and 5-year rates can be substantial. Case in point, at the end of 2013 3-month LIBOR was 0.25% and the 5-year Treasury was 1.74%. This implies a 150 basis point coupon advantage of bonds compared to loans (before adding spreads), which should persist until the Fed changes its easy money policy conditions.
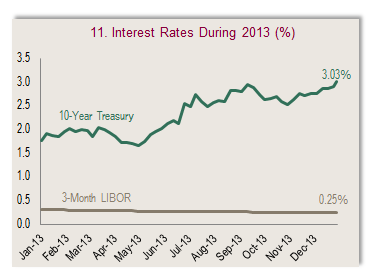
Another subtlety related to loans’ perceived interest rate protection lies in the term “interest rates”. It would be more appropriate to state that bank loans provide a hedge against large rises in short-term LIBOR rather than interest rates. After all, it is short-term LIBOR from which bank loan coupon payments are established. Bank loans do not provide a hedge for investors when long-term rates increase while short-term rates remain constant or decline (i.e. when the yield curve steepens). In 2013, for example, the 10-Year Treasury yield increased by 127 basis points over the year but 3-Month LIBOR actually decreased as shown in Chart 11.
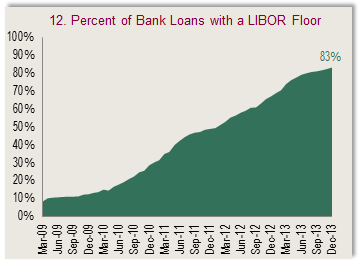
Another factor that reduces bank loans’ hedge against rising interest rates are LIBOR floors. LIBOR has persisted at well below 1% since the financial crisis—more than four years now. As a result, more and more bank loans have been structured to include a LIBOR floor feature—83% as shown in Chart 12.
A LIBOR floor creates a minimum base level from which the loan’s coupon rate is calculated. For example, instead of paying a coupon of LIBOR +400 basis points, a loan may pay LIBOR + 400 basis points but no less than 550 basis points (implying a LIBOR floor of 150 basis points). This is a beneficial feature for investors because it provides a minimum base from which coupon rates are set. In the current ultra-low LIBOR environment, however, it prevents coupon rates from being reset upwards due to small/moderate increases in LIBOR (until LIBOR increases above the floor). The average LIBOR floor is 110 basis points. Based on the forward curve, 3-Month LIBOR is not expected to exceed this level for nearly two years.
Historical performance patterns
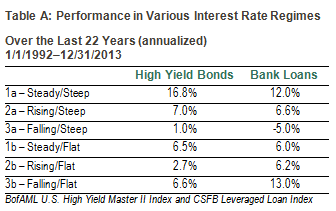
It is interesting to compare the returns of high yield bonds and bank loans during various interest rate regimes. We divide the interest rate environments into 1) steady; 2) rising; or 3) falling, and also by the shape of the yield curve a) steep/normal; or b) flat/inverted. This spawns in six different interest rate combinations: 1a, 2a, 3a, 1b, 2b, and 3b. We have been in steady/steep rate environment (1a) since the beginning of 2009.
Table A shows the performance of high yield bonds and bank loans in the six possible interest rate environments over the last 22 years. High yield bonds have outperformed bank loans in steady/steep environments (1a), like the one we have been in for five years. Historically, a steady/steep environment (1a) has been followed by a rising/steep environment (2a)—high yield bonds have also outperformed during these environments, albeit by a narrow margin.
Loans appeal to short-term, leveraged investors
Bank loans appeal to a different buying base than high yield bonds. Loans are typically senior secured and have little interest rate risk—an attractive combination for leveraged investors, which are most often hedge funds and structured product investors. Because high yield bonds do not share most of these characteristics, they are too complicated for leveraged investors to easily manage (i.e. hedge).
The constituency of the investor base is important because it can influence the behavior of the bond/loan during liquidity events and/or cyclical end points. High yield bond investors, for example, tend to have long-term investment objectives, and initiate long-term positions accordingly. While these investors attempt to avoid negative returns, it is generally
accepted that short/medium length periods of negative returns are inevitable. Hedge funds and structured product investors, however, often have investment motivations that are at odds with an efficiently operating marketplace. Hedge funds tend to exacerbate selling events in a race to avoid negative returns. Structured products also tend to exacerbate selling events, but do so via automated (i.e. black-box) decisions that are not always derived from sound economic rationale. The net effect is that both constituencies tend to amplify volatility of loans during liquidity crunches or cyclical turning points compared to high yield bonds.
Conclusion
During the normal course of our business we receive many questions on the credit market. These questions come from investors with diverse perspectives. We addressed those questions that seem to be asked most frequently, and hopefully provided some newfound insight. We look forward to receiving new questions in the future, and asking some ourselves. As Albert Einstein noted in the opening quote, “The important thing is to not stop questioning.”
Hotchkis & Wiley High Yield Research
1 BofA Merrill Lynch U.S. High Yield Master II Index
2 JPMorgan
Past performance is not a guarantee or reliable indicator of future results. Index performance is not indicative of fund performance. An investment cannot be made directly in an index. To obtain fund performance please visit www.hwcm.com.
You should consider the Fund’s investment objectives, risks, and charges and expenses carefully before you invest. This and other important information is contained in the Fund’s summary prospectus and prospectus, which can be obtained by calling 800-796-5606 or visiting our website at www.hwcm.com. Read carefully before you invest.