Last week’s meeting of the Federal Open Market Committee (FOMC) produced a more hawkish tone than anticipated, driving interest rates higher and flattening the yield curve in the process. Between the Fed’s summary of economic projections and Chairwoman Janet Yellen’s remarks following the meeting, the FOMC suggested a shorter timeframe for rate hikes than the market had expected. In a commentary dated last November (Fed Fatigue), we noted that the changing makeup of the Committee through the addition of more “hawkish” members was likely to create additional interest rate volatility—and opportunity—in 2014. The only certain outcome from last week’s meeting is the continued reduction in monthly purchase of Treasuries and mortgages by the Fed. At the end of the day, any change in interest rate policy is still data dependent. The Fed will tighten eventually, but not unless or until the economy and inflation reach levels that warrant it. With first quarter GDP expected to be 1.5%—and with last week’s Consumer Price Index (CPI) registering only +1.1% year over year rise, Castleton does not share the view that a more aggressive Fed will raise short rates sooner than previously believed.

Weekly Change: 10Y Treasury Yields vs. 10Y AAA MMD
Source: Bloomberg, Thomson Reuters and Castleton Partners

Ratio of 10Y Municipal Yield to 10Y Treasury Yield
Source: Bloomberg, Thomson Reuters and Castleton Partners
Officially, Treasury yields last week rose by 9bp in two years, 17bp in five years, 8bp in ten years, and only 1bp in thirty years. With $96 billion in Treasury supply expected this week, and with that supply heavily concentrated in the 2 to 7 year range, we expect the recent flattening trend to remain in place, with intermediate and longer dated bonds outperforming. Last year, interest rate risk in Treasuries was concentrated ten years on out, as the market wrestled with the beginning of the end to QE and the loss of its biggest buyer in that area of the curve (i.e. the Fed). With the changing composition of the FOMC, and with inflation remaining well below target, Castleton believes that interest rate volatility for the remainder of 2014 will be more concentrated towards the front of the yield curve.
Tax-Exempt
Despite being in an environment of favorable fundamentals and technicals, tax exempt prices softened noticeably last week, as the volatility in Treasury rates was too much to overcome. Like their taxable counterparts, higher tax exempt rates and a flatter yield curve were the primary themes. Five and ten year municipal benchmark yields increased 20 and 10 basis points, to yield a 1.27% and 2.52%, while 30 year benchmark yields rose only 6 basis points, to yield a 3.73%.
With intermediate and longer dated municipals registering larger price declines in 2013 versus shorter dated maturities, we long viewed the yield curve—and not credit—as the most attractive opportunity entering 2014 (The Tax Exempt Yield Curve: Revisited). The yield differential between benchmark 5 year muni spreads and 10 year muni spreads narrowed an additional 10 basis points last week, to +125. Despite this flattening, we still view intermediates as an attractive alternative to cash or short dated tax frees—where the value of the tax exemption has not been as high since the 1980’s. Using the Barclays Municipal Bond Index as a guide, the 10 year area of the muni yield curve has outperformed the 5 year area through March 24th YTD: +2.80% vs. +105%.
Historically, the end of the first quarter is a notoriously difficult time for tax exempt prices for several reasons: investors seasonally limit their purchases as they prepare for tax season; dealers tend to restrict capital so as not to expand their balance sheet for Q1 reporting; and supply starts to increase. If history remains true to form, the next two weeks may present an opportunity to purchase high quality liquid tax frees at generous concessions to their fair market value…
New issue supply is expected to be $5.5 billion this week, with the largest transactions being the State of California Public Works Board selling $893 million in lease revenue bonds, the City of Atlanta selling $700 million bonds for Atlanta Hartsfield Airport, and a $480 million loan for New York City Municipal Water Finance Authority.
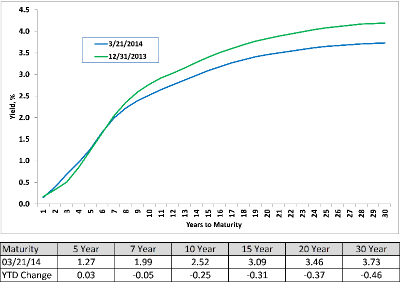
AAA Municipal Market Data (MMD) Yield Curve
Source: Thomson Reuters

Weekly Municipal Mutual Fund Flow Data
Source: Lipper AMG Data
Taxable
Despite new issue volume dropping sharply from the previous week, activity was fairly robust in investment grade corporates, with spreads tightening as much as 5-7 basis points versus Treasuries—mostly following the FOMC selloff. Over $2.2 billion of net new demand flowed to investment grade bond funds last week, driving secondary volume to accelerated levels. According to TRACE, a reporting system that tabulates fixed income trading by brokers, last Wednesday dealers sold a net $1.9 billion of high grade bonds to investors—the largest such sale day in four years. With just under $20 billion of new debt priced last week, the largest loan was a $4.25 billion offering by Exxon Mobil Corporation. Taking advantage of strong interest for short duration spread product, Exxon was able to price a 3 year note at 15 basis points over comparable maturity Treasuries, as well as a new 5 year at +25 to comparable maturity Treasuries.
With nearly $400 billion of supply priced so far in 2014—and in sharp contrast to their tax exempt counterparts, taxable dealers have been steadily increasing their inventory of investment grade bonds. The Federal Reserve Bank of New York tabulates weekly dealer commitments to various fixed income sectors. At $16.3 billion, the inventory of investment grade bonds held by brokers is at the highest level since the Fed starting reporting the data in April 2013.
Despite the sharp outperformance last week of high grade bonds, we remain cautious on taxable spreads. With interest rate volatility moving to the front end of the yield curve, we believe further spread tightening is limited, as the narrow yield advantage can easily be erased with even a small rise in rates.
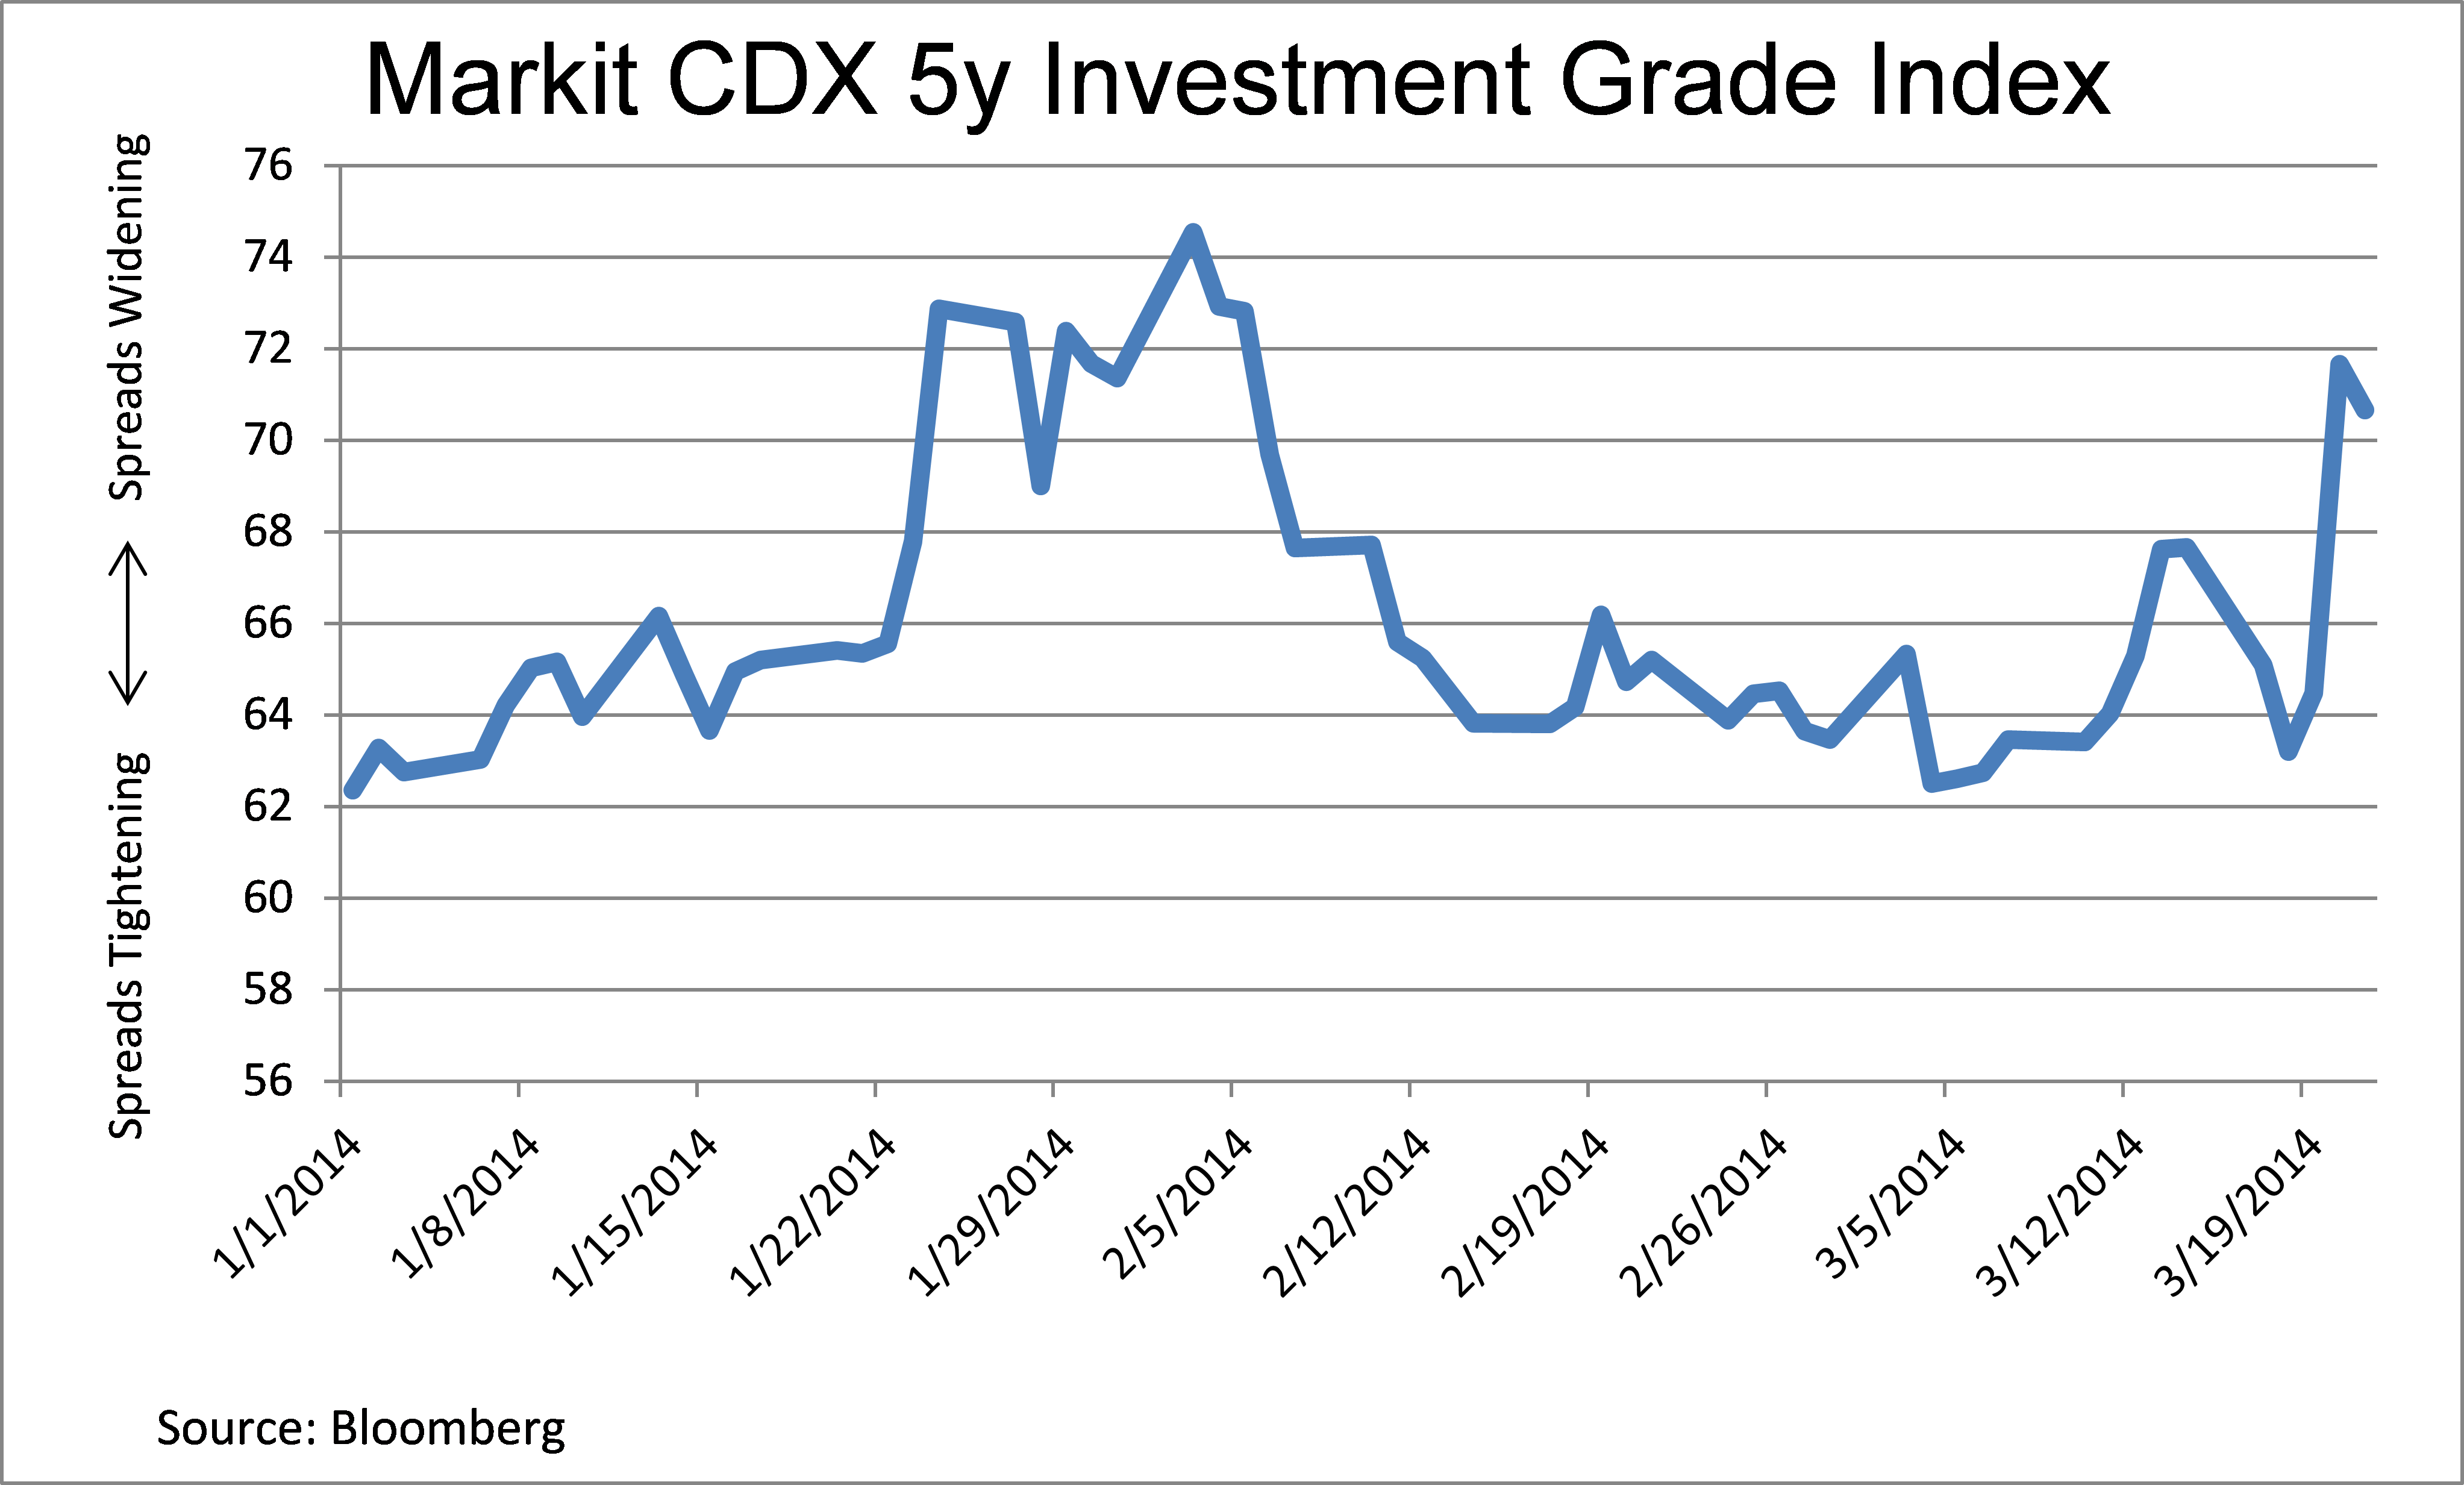
*Note: The rise in the index is entirely attributed to a new front month contract that trades at a premium to an older, more seasoned version of the index.


