With military tensions rising over the Ukraine saga and geopolitical posturing dominating the headlines, Treasury rates rallied across the yield curve last week, with 10 year yields falling 13 basis points to 2.66%. Though Cold War-era rhetoric remains high, there are indications that the threat of military action is becoming less likely. As such, we suspect markets will become more comfortable with the situation and expect it to become less of a focus. Nonetheless, we concede that headline risk remains and the primary influence on the Treasury market this week may well be external.
Domestically, the bulk of this week’s focus will be on the two-day Federal Reserve meeting, which will be Janet Yellen’s first. We expect the Fed to deliver another $10 billion of tapering and reduce its monthly purchases of Treasuries and mortgage-backed securities to $55 billion. As stated previously, we fully expect the Fed to conclude their bond buying program in the fourth quarter of 2014—ending its influence over long-dated interest rates, which have remained in a managed state for several years.
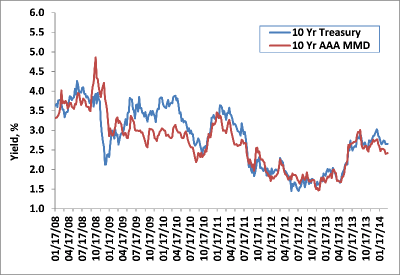
Weekly Change: 10Y Treasury Yields vs. 10Y AAA MMD
Source: Bloomberg, Thomson Reuters and Castleton Partners
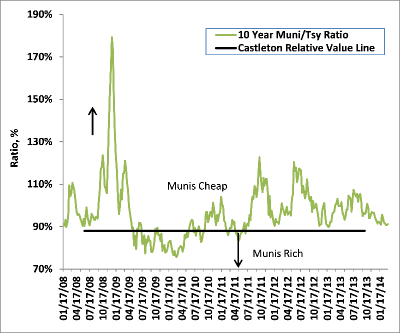
Ratio of 10Y Muni Yield to 10Y Treasury Yield
Source: Bloomberg, Thomson Reuters and Castleton Partners
Tax-Exempt
With fund flows and bank demand remaining positive, tax exempt investors easily absorbed the largest supply week ($11 billion) since December, driving municipal bond prices sharply higher and flattening the yield curve in the process. The strength across new issues flowed to secondary transactions as well, with the dealer community aggressively bidding bonds and further extending tax exempts’ 2014 lead as the top performing fixed income sector. For the week, intermediate tax exempts ended up better by 8- 12 basis points, while longer dated maturities improved as much as 17 basis points. Ten year high grade tax free rates closed at 2.42%, with the Muni/ Treasury ratio unchanged at 91%.
In the most eagerly awaited tax exempt transaction in recent memory, Puerto Rico sold $3.5 billion of new general obligation debt at a yield of 8.72% last week. With a final maturity of 2035, this loan received over 16 billion in orders from 270 different accounts—primarily from non-traditional buyers of muni debt (i.e. hedge funds). The proceeds from the offering will mostly be applied to refinancing short term maturities and paying down lines of credit. It is believed that this loan will satisfy all of the Commonwealth’s liquidity needs through at least the end of 2015.
Last week’s other ‘mega deal’, a $1.8 billion State of California loan, also saw tremendous interest. With California supply running nearly 60% below last year’s level, demand was so robust that the State was able to upsize their loan and lower their yields. With a top state income tax rate of 13.3% for California residents, 70% of the loan was priced directly to retail investors. Other large loans sales from the City of Houston, New York State Dorm Authority and the City of Chicago all saw similar demand and higher prices.
With municipal yields falling at a faster rate than taxable yields in 2014, the yield curve continues to compress, driven by tax sensitive demand for excess income in a low rate world. The yield spread between a 2 year and 10 year high grade tax free maturity has now fallen to +215 basis points, as ten year securities outperform shorter dated municipals. This is a decline of 39 basis points so far in 2014, and the lowest level since November. Despite the flattening of the yield curve to date, we maintain the view that extending maturity—in most instances, even just a few years—greatly improves one’s income and total return potential.
New issue supply this week reverts back to its 2014 norm, with only about $3 billion expected to price. Only three transactions are in excess of $250 million: $394mm Wisconsin Transportation, $345mm New York Environmental, $293mm Clark County Nevada.
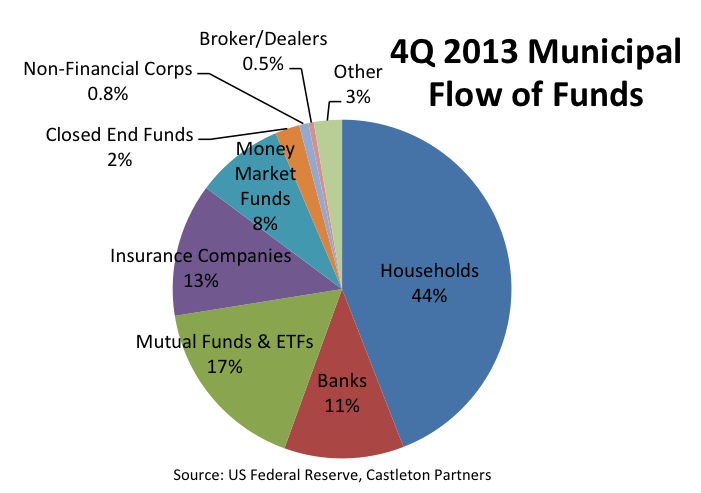
Update: Holders of Tax-Exempt Debt
Last week, the Federal Reserve released their flow of funds data for the fourth quarter of 2013. With more debt maturing than being issued by state and local governments, total outstanding supply of municipals declined by $14.5 billion to $3.67 trillion. Households remain the largest owners of tax free bonds, though the importance of banks continues to increase. Banks, as of December 31, 2013, own over $416 billion of municipals—a rise of nearly 15% since 2012.
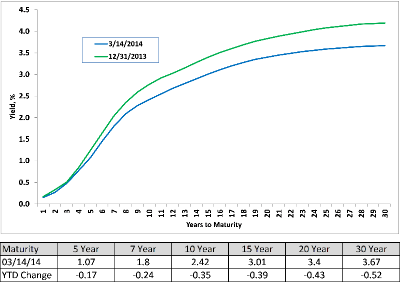
AAA Municipal Market Data (MMD) Yield Curve
Source: Thomson Reuters
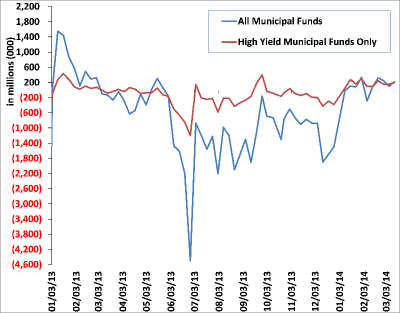
Weekly Municipal Mutual Fund Flow Data
Source: Lipper AMG Data
Taxable
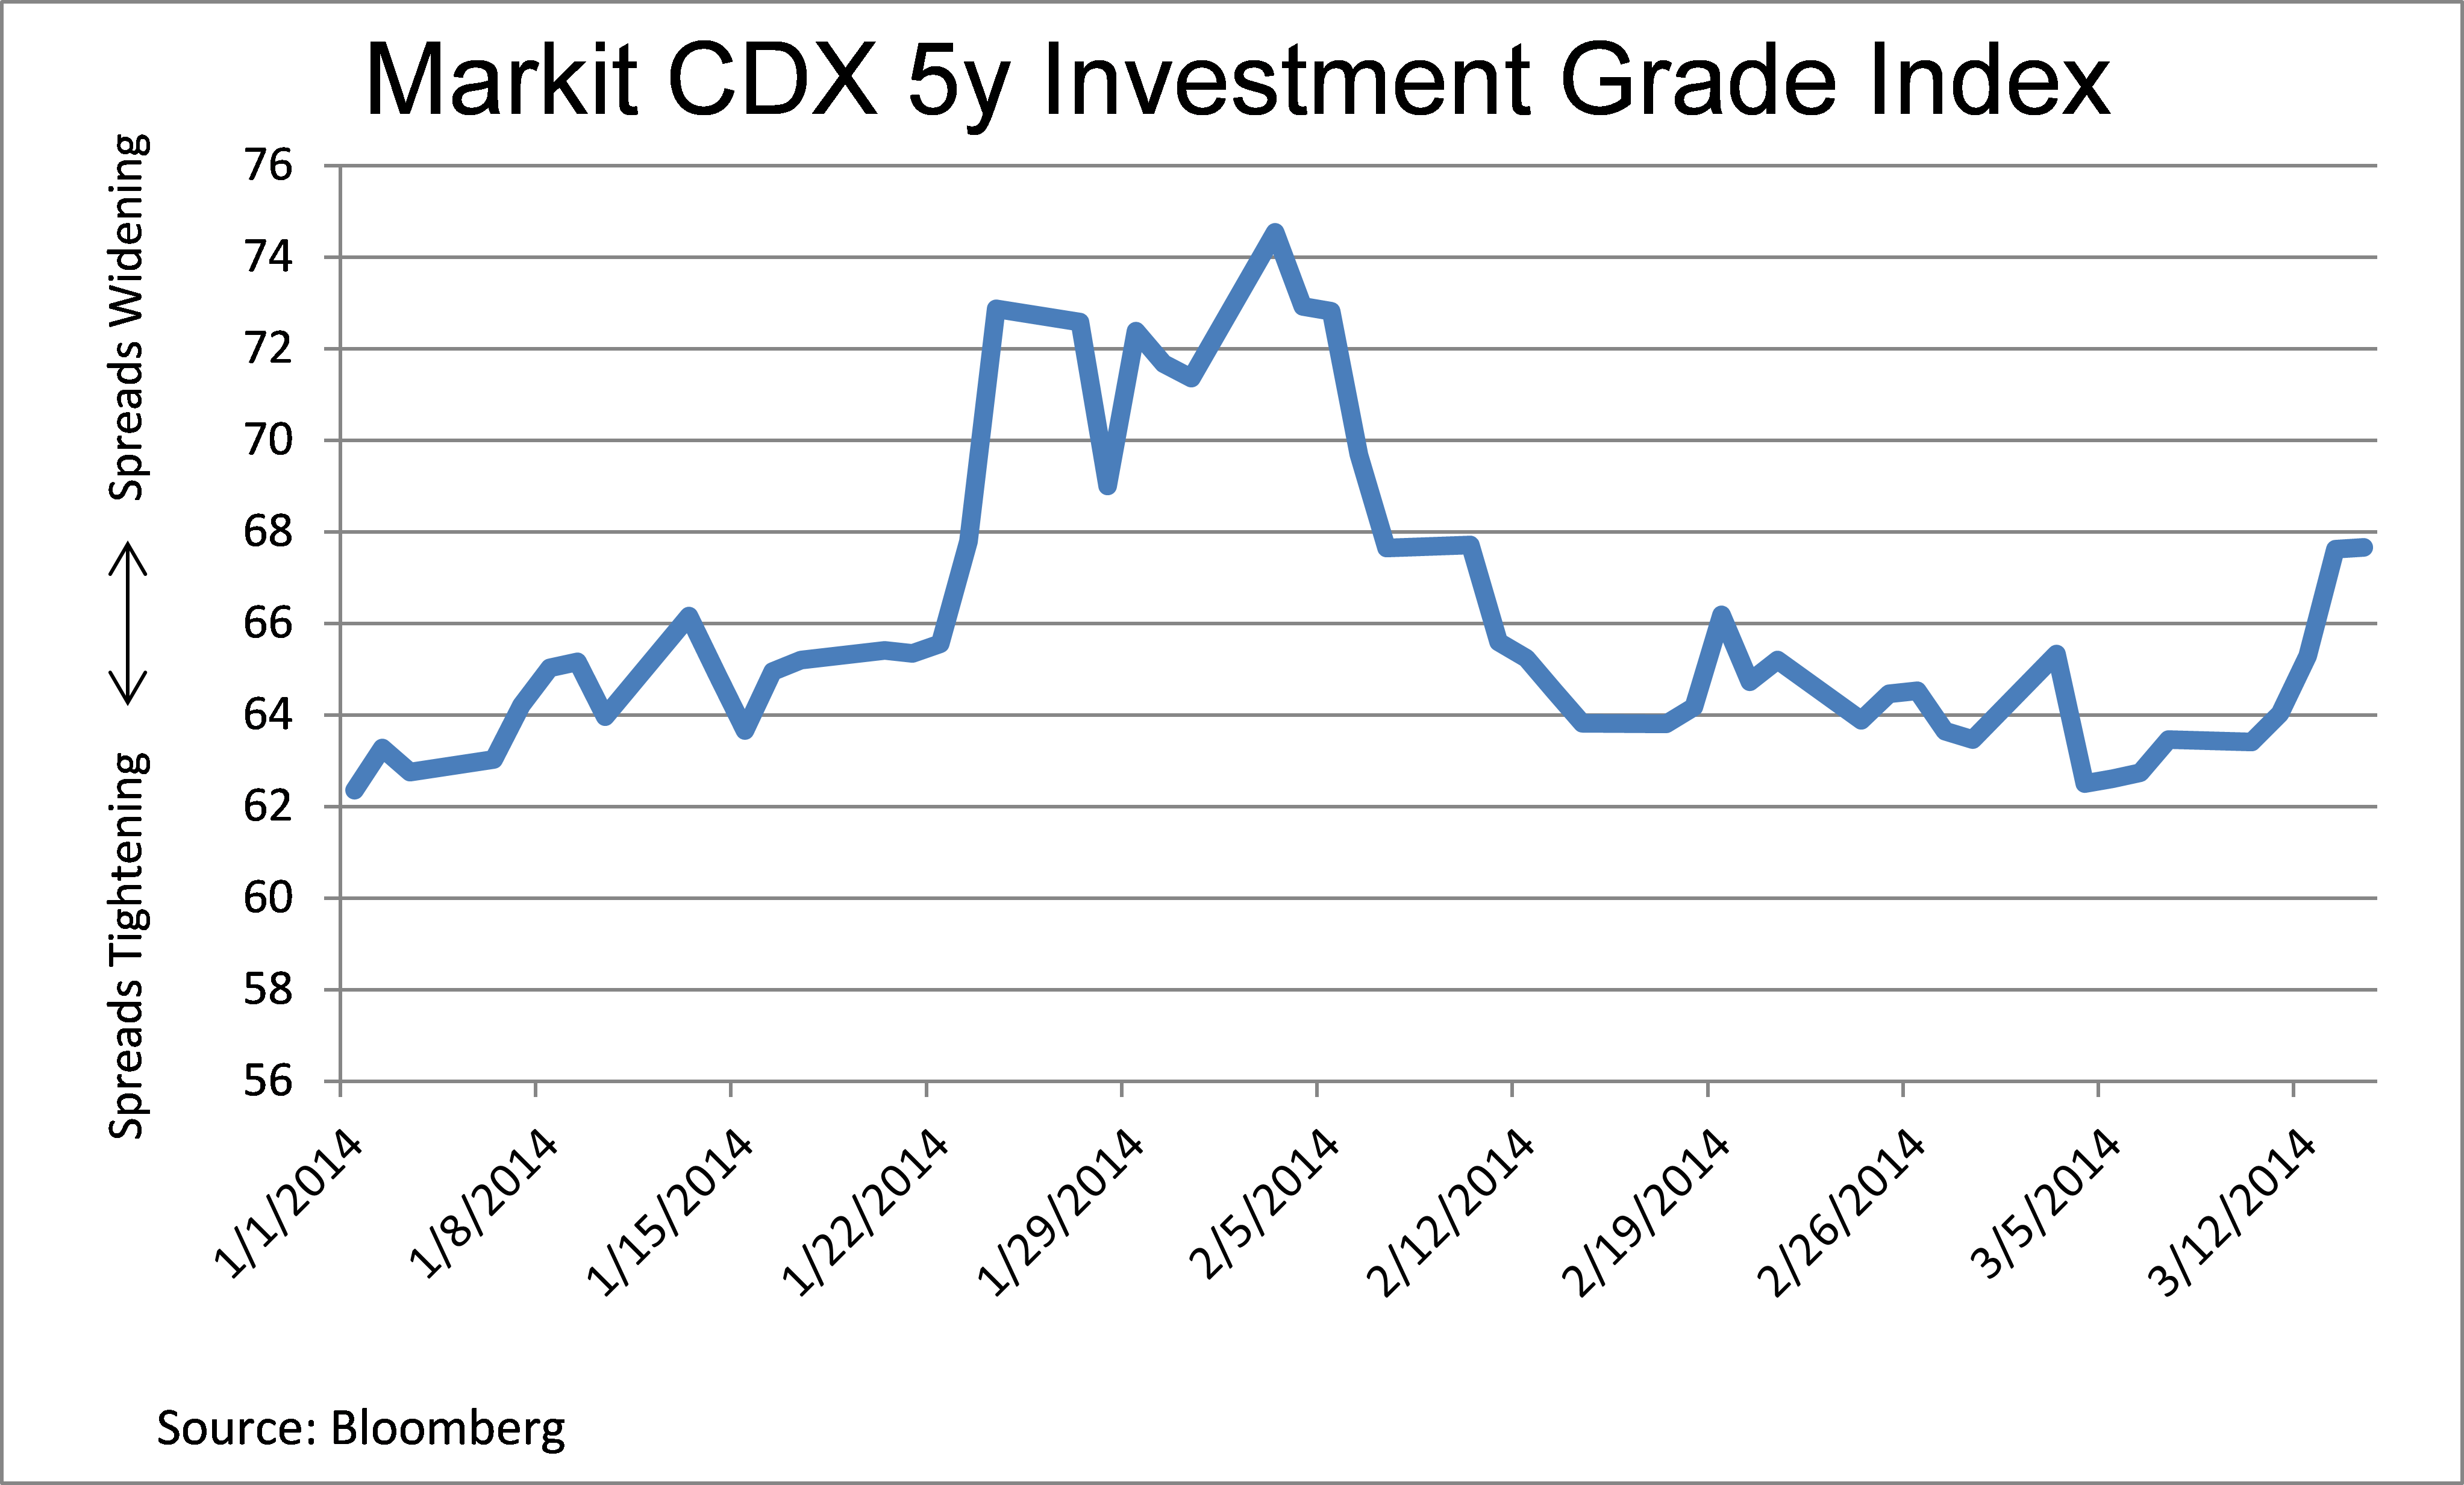
Investment grade corporate bond spreads widened, on average, 4-6 basis points last week, as Treasury yield fell. Supply—and spread concessions to existing debt—remains the theme so far in 2014. Another $45 billion of debt was priced last week, bringing the year to date total to over $350 billion. Verizon Communications, fresh off their record $49 billion deal last fall, priced another $4.5 billion in the week’s largest deal. The proceeds of this new loan were used to finance a tender offer by VZ for some of their outstanding high coupon debt. With interest rates still trending near historical lows—and 50 basis points below the 2013 highs, companies continue to refinance debt into lower interest rates. The net benefit to credit investors is materially improved coverage ratios for debt service. But, Castleton remains cautious on the sector due to tight valuations and the view that fundamentals are vulnerable, as re-leveraging activity may increase due to aggressive tactics benefitting equity holders (share buybacks; dividend increases) at the expense of debt holders.
© 2014 Castleton Partners, LLC. All rights reserved.
THE FOLLOWING NOTES AND DISCLOSURES ARE AN INTEGRAL PART OF THIS REPORT: Past performance is not a guarantee of future results. Different investments involve varying degrees of risk, including the risk of illiquidity and the risk that you could lose part or all of your investment. There can be no assurance that the future performance of any specific investment, investment strategy, or product (including those discussed herein or recommended or undertaken by Castleton Partners, LLC) will be profitable, equal any corresponding indicated historical performance, be suitable for your portfolio or individual situation, or prove successful. Charts, graphs and indices are included herein only for reference and do not constitute forecasts of the past or predicted future performance of any investment. Indices are not investments. Due to changing market conditions and other factors the content herein may no longer reflect Castleton Partners, LLC’s current opinions or positions. Nothing discussed herein is or is intended as tax, legal, accounting or personalized investment advice from Castleton Partners, LLC. Should you have any questions regarding the applicability of any specific issue discussed herein we encourage you to consult competent advisers of your choosing. Nothing herein is or is intended as an offer to sell or a solicitation of offers to buy any security. Castleton Partners, LLC’s current written disclosure statement including discussion of our advisory services and fees is available upon request.


