In any competition, sports or investment management, there are lessons to learn to improve and better results. That’s why football players and coaches sit side-by-side for hours poring over the team’s performance. What worked? What didn’t? Every play, despite whether the game was won or lost, is dissected.
We replay our “game film” of the funds on a daily basis, scrutinizing our stock selection process along with macro factors to analyze what contributed to or detracted from performance.
Here’s one of the many charts we review that compares the Holmes Macro Trends Fund (ACBGX) against its benchmark S&P 1500 Index. You can see the fund’s attractive risk and return profile over the past year, as it outperformed its benchmark while only adding a few basis points of risk.
But, just as every great coach or experienced investment manager tries to answer, how is that performance repeated and is it possible to further boost absolute returns?
We believe there’s a way that increases the odds of winning. It’s by combining a bottom-up approach with a top-down strategy: Find great, fast-growing and shareholder-focused companies and focus on the best stocks in the sectors experiencing positive momentum. That’s the approach the Holmes Macro Trends Fund takes.
Bottom-Up: Finding “True Growth” Companies
Fast-growing and shareholder-focused companies are bred with distinct strands of DNA that drive their success. “True growth” businesses typically have revenues growing at more than 10 percent (or about five times faster than U.S. nominal GDP), generate a high 20 percent earnings growth rate, and have at least 20 percent return on equity.
Research shows that companies with these superior growth qualities have outperformed over time.
Top-Down: Emphasis on Strongest Sectors
However, depending on the market cycle, certain sectors can be in or out of favor. Sometimes cyclical stocks outperform; other times, defensive stocks rise in value.
Oftentimes, there are factors that drive or inhibit their performance. It could be government policies, such as Obamacare boosting many health care companies. Or it could be the falling price of a resource that narrows the profit margins of miners.
The result is wide price fluctuations among sectors from year-to-year. If you look at the annual returns over the past decade of each of the 10 sectors in the S&P 500 Index, in any given year the average difference between the best-performing sector and the worst-performing sector has been around 36 percent.
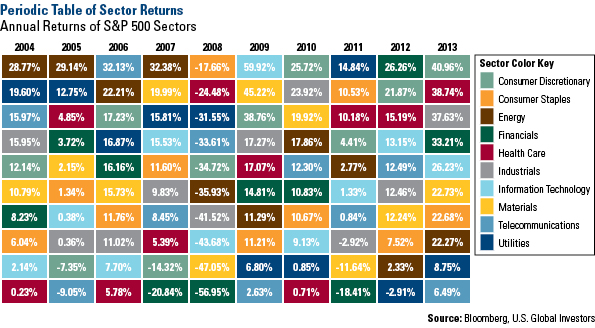
Identifying and overweighting the top-performing sectors increases the odds that the portfolio will outperform its benchmark. Alternatively, it is just as important to minimize investing in the bottom sectors.
Therefore, the goal is to tactically allocate capital to the most robust sectors with identifiable long-term trends and underweight sectors with the weakest trends.
Today, our proprietary model tells us the top sectors are consumer discretionary, health care and industrials and the data is backed by several familiar trends. For consumer discretionary, we see growth in retailers and consumer Internet companies. In health care, there are new products, favorable demographics and visible growth. The synchronized global economic recovery and energy infrastructure are driving industrials.
What’s Driving Energy?
Over the past several months, we’ve published many times on the great U.S. energy boom, but we continue to believe many investors are underestimating the impact this spectacular renaissance will have on the global oil and gas landscape for years to come. In fact, take a look at this chart highlighting the fact that U.S. crude oil production is at a 25-year high!

Our new Special Energy Report expands on this topic as well as what you should look for when investing in the sector.
Expense ratios as stated in the most recent prospectus. Performance data quoted above is historical. Past performance is no guarantee of future results. Results reflect the reinvestment of dividends and other earnings. Current performance may be higher or lower than the performance data quoted. The principal value and investment return of an investment will fluctuate so that your shares, when redeemed, may be worth more or less than their original cost. Performance does not include the effect of any direct fees described in the fund's prospectus (e.g., short-term trading fees of 0.05%) which, if applicable, would lower your total returns. Performance quoted for periods of one year or less is cumulative and not annualized. Obtain performance data current to the most recent month-end at www.usfunds.com or 1-800-US-FUNDS.
Please consider carefully a fund’s investment objectives, risks, charges and expenses. For this and other important information, obtain a fund prospectus by visiting www.usfunds.com or by calling 1-800-US-FUNDS (1-800-873-8637). Read it carefully before investing. Distributed by U.S. Global Brokerage, Inc.
The S&P 1500 Composite is a broad-based capitalization-weighted index of 1500 U.S. companies and is comprised of the S&P 400, S&P 500, and the S&P 600. The S&P 500 Index is a widely recognized capitalization-weighted index of 500 common stock prices in U.S. companies. All opinions expressed and data provided are subject to change without notice. Some of these opinions may not be appropriate to every investor.
© U.S. Global Investors


