Back in July, we used technical analysis to anticipate a “head & shoulders” bottom in AAPL. Now that the minimum price objective of $550 has been achieved, we ask a deeper question: What does market behavior have to say about AAPL’s longer-term prospects?
Apple is undoubtedly a great company with great products. It also has a reasonable valuation by most measures. There is just one problem. Market capitalization has become very large, topping out in September 2012 at 4.8% of the S&P 500 Index. This brings up an uncomfortable analogy with Microsoft, another bulge-bracket technology firm that, once upon a time, could do no wrong.
Much like AAPL today, MSFT ascended a very steep path to market dominance, reaching a 4.4% weight in the S&P 500 by December 1999. See charts 1 & 2 below.
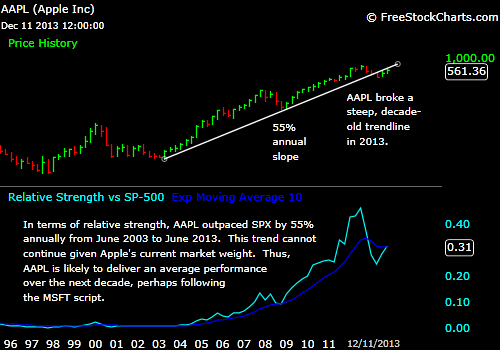
But steep trends are mathematically unsustainable. No stock can forever outpace the market at a 40-50% annualized clip. If MSFT had continued its relative performance of the 1990’s, it would now be the S&P 500. The same logic applies to AAPL. Over the long haul, we should not expect the stock to resume its pre-2013 trend, no matter how well the company executes its business plan.
AAPL is more likely to follow the MSFT script, delivering an average market performance in coming years. Yes, these two enterprises are fundamentally different. But we suspect a “law” of large size is at play. Interestingly, Microsoft’s 1999 shareholder letter clearly acknowledged the need to evolve toward the internet and mobile computing. This did not stop new competitors, including Apple, from gaining market share.
The point here is not to dump AAPL now that its major trend has been damaged. Rather, one should adopt a sensible expectation toward relative performance going forward. The post-1999 MSFT analogy provides one interesting clue. In all probability, AAPL has shifted from a “momentum” stock to a “mean reversion” stock and should be managed accordingly.
Chart 1
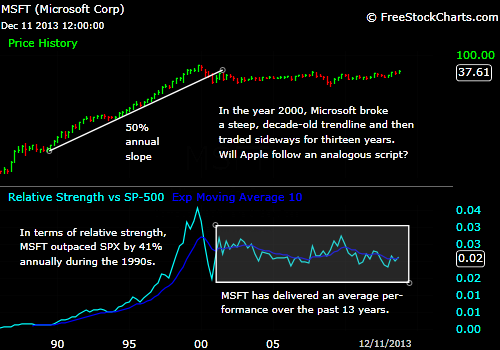
Chart 2
© Charter Trust Company


