A Week To Remember in Muni Land! Detroit and Illinois and Must Read Employment Data
What a week! Illinois passed pension legislation (I would have lost that bet) and Detroit can proceed with its bankruptcy. On the former, let’s see if the long-overdue pension fix survives legal challenges from unions and helps Chicago address its pension issue. Perhaps those contemplating the legal challenge will look to Judge Steven Rhodes’ opinion in the Detroit bankruptcy case to find that he believes pension obligations are no different than any other contractual obligation.
“Nothing distinguishes pension debt in a municipal bankruptcy case from any other debt.” Judge Steven Rhodes.
While Judge Rhodes’ ruling will be challenged, it seems the once unthinkable has occurred with regard to pension obligations being categorized as no different from any other debt. In other words, subject to a haircut in bankruptcy. While there have been a number of instances of municipalities negotiating pension fixes, perhaps, where the unfunded liabilities are so severe and there has been limited appetite to take steps, one can surmise the mood of others may change. Below is a peek at some of the 27 States with a Funded Ratio of less than 70% (using their reported discount rate v an arguably more reasonable 5%).
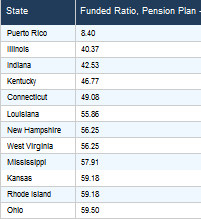
DIVER Analytics, Filter Module, State CAFRs
DC’s Holiday Spirit
In what may be a sign of the holiday spirit, it seems the folks in DC are at least trying to install some holiday window dressing -- rumor has it that there is a deal to be had on capital hill. Ok, not the grand deal we had hoped for but something to avoid or blunt the sequester cuts (that can be good for those of you with BABS). In fact, it appears a two year deal is on the horizon – this way our elected officials need not be disturbed with a budget deal while worrying about re-election! At least we avoid the prospect and drama of another government shutdown. The deal includes “increased fees” (airport security fees and federal guarantees of private pensions – this is really going to offset all of those draconian cuts to defense and other areas?!) and “cuts in mandatory spending programs” (haven’t found much in the way of details here). Bottom line is a deal just might allow progress to occur in other areas or simply allow the election fracas to get started even sooner. Uggh!
First Friday and Details from Prior Months
In the words of the late Andy Rooney, “Did you ever wonder …” I ask, “did you ever wonder why there is a push to extend the expiring extended unemployment benefits if unemployment is dropping monthly and the economy is improving?” The First Friday report tells us the rate is now 7% -- down from 7.2% just a month earlier (more on this in a moment). Turing to Arnold Horshack, “Pick me Mr. Kotter,” I think I (and those pushing for this extension) might have a clue why.
Last week was a catch-up week for a number of government agencies that report data. The detailed county-level employment data seemed to slip under the radar of some – those pesky details. Well, you might want to take a closer look—I think some of our elected officials in DC actually did. While the markets cheered the First Friday report and the media blared the headline of 7% unemployment, even I (accused by some of not seeing things thru rose-colored glasses) was surprised to see the results:
- Number of People Employed was less than it was a year prior in 2,109 counties
- Employed as a % of Population for October was less in 2,107 counties than it was a year earlier
- 775 Counties saw Unemployment Rise and their Labor Force Decline (that’s really bad)
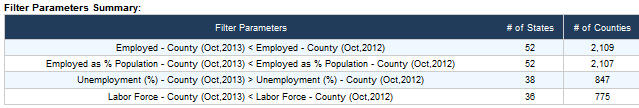
DIVER Analytics, Filter Module, BLS, USCB, Lumesis
- Job Growth at the County level for October averaged -.76% and only 1,154 counties saw positive Job Growth (only yellow, green and blue below show growth)
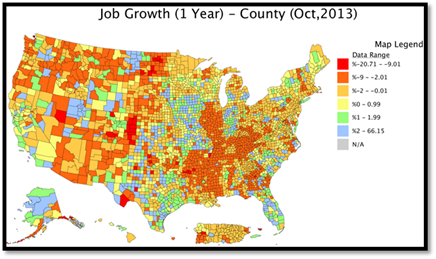
DIVER Analytics, Map Module, BLS
If this hasn’t hit you yet please stop for a moment and contemplate this data. These are facts – no spin for the left or right or from Fox or CNN. We are far from out of the woods. I hate being the “glass half-empty guy” but I have a hard time saying things are better for most when the facts say otherwise.
Oh, and if you are a fan of the First Friday report – seems at least some of the near term good news was the result of Federal workers returning to work after their paid time off courtesy of Congress and the Executive branch (we will provide a full analysis once the November and December details are released). Long-term unemployment was basically unchanged as was the labor force participation rate (63%) and employment to population ratio reverted to where it was prior to the shutdown. There was an increase in the number of employed but the details are not clear as to how much of that was the result of federal workers getting back to work. Here are some data points reported by the NYT (buried below the headlines and the fold):
- “To get to a jobless rate of 6% while returning to the labor force participation rate that prevailed at the recession’s end in June 2009 would require nearly seven more years of monthly job growth at November’s pace.”
- “The number of unemployed fell by 348,000 … but the number of people with jobs increased by only 83,000.”
- Referring to the “5% rate that economists consider full employment. At the current rate of job creation, unemployment would fall to 6.4% by the end of 2014 and still be around 5.7% in late 2015.”
- “No improvement was seen in the fate of the long-term unemployed … actually rising slightly in November to 4.06 million.”
As regular readers know, I take the First Friday report with a shaker full of salt but, wow, even the NYT’s couldn’t mask some of these hard facts. I will wait for and report on the details when released.
Concluding on Something Positive
Last week, I promised to try and find a way to conclude my commentary on a more positive note. As a man of my word and it being the holiday season, I offer some perspective courtesy of our friends at the Philly Fed and their Leading Index which predicts the six month growth rate of each States Coincident Index. The brighter yellow color, green and blue States exceed what some refer to as the new normal for GDP growth in the US (2%) – 15 States. How’s that for being more positive!
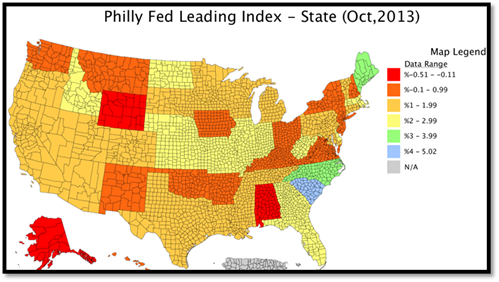
DIVER Analytics, Map Module, Federal Reserve Bank of Philadelphia
As we come into the final weeks of the year, the Lumesis team is racking up the frequent flyer miles and doing our best to spread good cheer. Mike will be hitting Indianapolis, Louisville, Detroit and Minneapolis and Gregg will be in NYC, St. Louis and San Francisco.
Have a great week.
Gregg L. Bienstock
CEO & Co-Founder, Lumesis, Inc.
Data Released Last Week:
- UPDATED: Fed. Funds Received, State and County, 2013
- Delinquency Rate (Res. Mortgage), State, Oct 2013
- Defense Expenditures as % of GDP, State, 2012, 2013
- Food Stamp Change, State, Sep 2013
- Employed as % Population, County, Sep & Oct 2013
- Weekly Initial and Continued Jobless Claims, State, 11/23/2013
- Job Growth, County, Sep & Oct 2013
- Labor Force, County, Sep & Oct 2013
- Philly Fed Leading Index, State, Sep & Oct 2013
- Exports Total (Monthly), State, Oct 2013
- UPDATED: DIVER Geo Score, State, County and Place, Current & Trend, Nov 2013
- UPDATED: Bankruptcy Filings – Issuers, State, County 2013
- UPDATED: Default Filings – Issuers, State, County, 2013
- FEMA Disasters, County, TYD 2013
© Lumesis


