Following a wonderful Thanksgiving holiday that involved way too much food, I found myself doing all I could to avoid the Black Friday masses and succeeded until I took to the highway for a journey to Albany, NY – they were leaving the malls and, perhaps it was exhaustion from their day of shopping, but the traffic and driving skills left something to be desired. Those weary shoppers amassed along I-87 brought to mind the question of how healthy (or not so healthy) is the economy? To help answer this question, I take a look at the Philly Fed’s Coincident Index (released last week), the DIVER Geo Score (released this morning) and Housing Price data (not as rosy as you might think). You should also take note that, according to the National Retail Federation, estimated sales for this past weekend (which included Black Friday) were down 2.9% from last year – not exactly the signs of a robust, growing economy.
November Geo Score – Stacking it up v. the Fed’s Coincident Index
Amongst the many data sets the DIVER platform tracks is the Philly Fed’s Coincident Index Change (thanks AW for the suggestion). The index change tracks the month over month change in the referenced location’s Coincident Index which is a combination of variables tracking certain employment data, hours worked in manufacturing and wage and salary disbursements deflated by the CPI. According to the Philly Fed, 45 States are seeing growth in their Coincident Index. The DIVER Geo Score, a relative score of the economic well-being of the referenced location, considers data around employment, housing and income.
How does the Geo Score stack up against the Coincident Index Change? Pretty well. I took all States with a Geo Score greater than 5 (meaning, on a relative basis, they are better off then those at or below 5). The objective was to see if the Philly Fed saw differently (not growing would be the natural corollary). The short answer is “no” as highlighted in the table below although the degree of how well a State is doing is not as consistent in some cases (see South Dakota, Vermont and Minnesota).
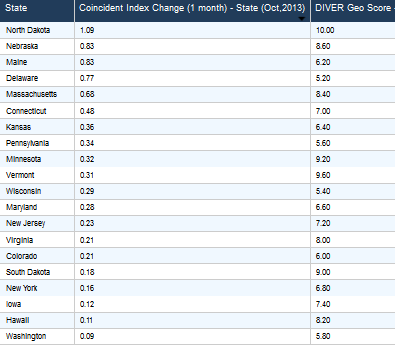
DIVER Analytics, Filter Module, Philly Fed.
I encourage you to also explore the trend Geo Score in conjunction with the monthly score. Visit http://www.lumesis.com/our-solutions/current-scores to access the latest Geo Scores at the State, County and City (375) levels.
November Geo Score – A Look at the Benchmarks
Given many folks mange to a benchmark, I thought it might be interesting to take a look at the Geo Score for two primary benchmarks – the S&P National AMT-Free Municipal Bond Index and the Barclays Municipal Index. Interestingly, both have trended positively with the S&P scoring slightly better than the Barclays. Looking at the 11 data fields auto-tracked in DIVER Analytics, the primary distinguishing factors on a portfolio weighted basis, are Poverty, Unemployment and Pension Funded Ratio. To see how your portfolio stacks up against your benchmark, utilize the “Portfolio View” tab in DIVER Analytics.
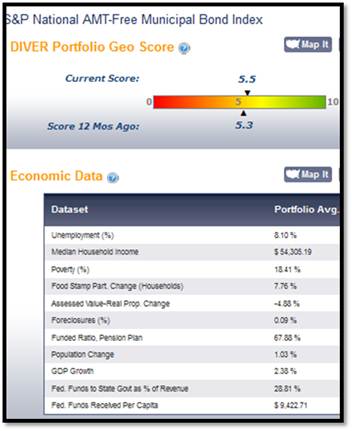
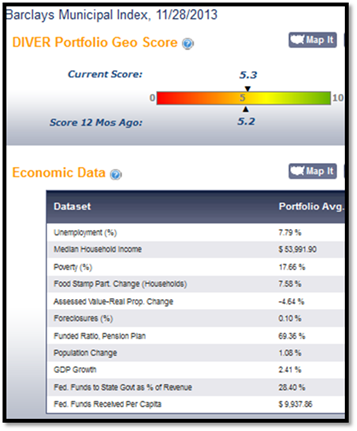
DIVER Analytics, Portfolio View
Housing – Some People Are Feeling Blue
It has nothing to do with the monstrosity being built across the street from my home (for the record, they tore down a charming little home and are building a house 2.5x the size). One might argue that it is a sign of a hot housing market (perhaps in NY) or possibly a sign of another housing bubble courtesy of the Fed (of course, they had nothing to do with it the last time out).
I wanted to see just how much Housing Prices have really recovered since the Great Recession. While the Great Recession started in the 4th quarter of 2007, I am going to use 3Q 2008 to date to see how the States are faring. Of the 50 States, only 22 have seen Housing Prices exceed their 3Q 2008 level – this is as of 3Q 2013. Of those, only 11 have seen an increase greater than 5% -- not per annum but overall. This is the reality despite historically low interest rates.
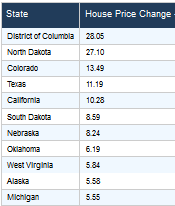
DIVER Analytics, Filter Module, FHFA.
For those of you that accuse me of seeing the glass as half empty, I offer some insight from Jeffrey Gundlach, as provided for in an article entitled “Two Bubble Hunters Size Up the World”, Barron’s, December 2, 2013 (the other “Bubble Hunter” – Robert Shiller).
Today, most investors, if they look at the housing data, would be surprised how weak it is, really… Pending home sales are trending lower. The absolute level of housing activity have risen from the deficit of 2008 and 2009, but they have risen to the levels that used to be characteristic of the depths of a recession. The data has rallied to a point where it looks poor by historical standards. It is just higher than it was from the incredibly low levels that we saw…
So it is hard to make the case for home prices really having a problem, unless you overlay higher interest rates, and it seems that one of the ideas behind quantitative easing is to help the housing market.
Emphasis supplied by yours truly.
Aside from the fact that we all would like to see the value of our home rise, one has to contemplate the concern of municipalities as assessed values, known to lag by up to 24 months, will not see (absent mil rate increases) property tax receipts rising back to pre-recession levels for some time.
I hate to leave off on a sour note but, as they say, “it is what it is.”
Have a great week and I will work on a more upbeat closing for next week.
For those of you celebrating, Happy Chanukah.
Gregg L. Bienstock
CEO & Co-Founder, Lumesis, Inc.
Data Released Last Week:
- Weekly Initial and Continued Jobless Claims, State, 11/16/2013
- Weekly Initial and Continuing Jobless Claims, State, 11/16/2013
- Drought Intensity, County, Nov, 2013
- UPDATED: Affordable Care Act Medicaid Expansion, State, Nov 2013
- Coincident Index Change, State, Sep & Oct, 2013
- House Price Change, State, 2008 Q3 – 2013 Q3
- House Price Change, State, 2012 Q3 – 2013 Q3
- Housing Price Index, County & State, 2013 Q3
- UPDATED: Bankruptcy Filings – Issuers, State, County 2013
- UPDATED: Default Filings –Issuers, State, County, 2013
© Lumesis


