While it may be true, as told by the Roman poet, Horace, and quoted by Ben Graham and David Dodd in their front piece to Security Analysis, that “many shall be restored that are fallen…”, it is also true that most of the “fallen” are never going to get back up. For this reason, we have never been in the “cigar butt” school of value investors and we do not operate in the belief that that extremely low relative or absolute share prices are enough to justify the purchase of a stock. As much as we dismiss the Efficient Market Hypothesis, mainly for its arrogant presumption that the market always gets it right, the market does “get it right” in enough instances that those looking solely for a cheap price often get just that: a cheaply priced stock that never proves profitable.
It is our practice that price must be combined with proven quality in order for the fallen to be restored. Otherwise, the purchase is pure speculation. It is the counterbalancing of quality with price that produces value. So, how does our firm define “quality”? In simplest terms, it is an enterprise’s ability to earn attractive or better than median returns on capital without resorting to the use of excessive financial leverage. We narrow our return analysis primarily to shareholders’ equity because both we and our clients are equity investors, though we also examine returns on total capital employed, assets, or invested capital.
In this pursuit of price and quality, our stock selection process involves two major steps: narrowing the universe of thousands of stocks to a manageable list of portfolio candidates via screening and then doing extensive analysis on the finalists to determine which ones make it into our portfolios. By comparing stocks on the basis of the share price per unit of earnings, cash flow, free cash flow, and/or book value, as well as historic margins, leverage, and returns, we are able to reduce the investable universe of some 7,000 global equities with market caps over $1 billion to around 100 or so ideas worth looking into more closely.
Backtesting : Our, or any manager’s, GIPS-certified returns are the most conclusive proof of the efficacy of our criteria and processes, but thanks to software and global databases, we can and do backtest the criteria from our screens, using them alone or in combination with other criteria which we believe indicate a potentially profitable intersection of price and quality. Over the summer, with the help of our intern, Michael Stephenson, we undertook such an examination of the efficacy of our standard screening criteria to better understand their theoretical performance over the past decade. We ask your indulgence to lay out our internal ground rules for thinking about backtesting because we believe it may be one of the most abused and misunderstood tools that modern finance. Bottom line: backtesting is not dispositive of anything, but it does provide some interesting insights about the period of time backtested.
We italicized “theoretical” in reference to performance because we have not based price and quality criteria in our actual screens solely on the basis of backtested results and we are at pains to emphasize this: our practice causes us to be curious about theory, rather than theory driving our practice. We use backtesting to better understand the performance of our actual portfolios, as well as to assess the efficacy of our core screening criteria. While we believe that free cash flow production, judicious use of leverage, and the proven or a credible opportunity to produce attractive returns on capital are the keys to long term commercial success going back to the 1600’s, around the same time capital markets, securities, and accounting arose. Through all vicissitudes, these characteristics have made their way to today, where they remain the hallmarks of a “good enterprise”. Yet, we also understand that the past is not a prediction of the future and that our society and its capital markets do change in substantive ways from decade to decade, sometimes year to year. So, we remain vigilant to the obsolescence and efficacy of our screening criteria.
Models, Complexity, and Utility : Backtesting or, indeed, any attempt to model a real world system, suffers from what is known as “Bonini’s Paradox.” Named after the Stanford Business School professor who first observed this issue at the dawn of computer-based modeling in 1963, the paradox is that the more detail and “reality” you add to a model, the less useful the model becomes because of the increasing complexity caused by the interaction of more and more criteria. Maps are a type of model, and if you are familiar with the subways of New York, Washington, D.C, or London, you will note that they are highly simplistic, bearing little resemblance to the actual world of tunnels, escalators, distances, and trains navigated by commuters. Yet, millions of first-time travelers to these cities successfully navigate using those maps every year. Adding three-dimensionality, buildings, roads, actual scale, etc., would render such maps confusing and perhaps impossible to use, hence the paradox. Thus, the backtester, in order to gain any utility from the backtest, must limit the number of factors or criteria to be tested.
Rebalancing and Weighting : With those problems and our skepticism made clear up front, we now move to the grittier, footnoted, but absolutely crucial, details involved in backtesting: how often to rebalance the theoretical portfolio and how the individual weights of the chosen stocks should be distributed. Thus, in addition to choosing a limited number of criteria, the backtester much also make practical decisions regarding the frequency with which the theoretical portfolio is rebalanced, such as daily, weekly, monthly, quarterly etc., as well as the size of each holding, whether in equal amounts across the board or skewed to reflect the market capitalizations.
Rebalancing : In the real world, daily rebalancing of any moderately large portfolio or group of portfolios is a logistically difficult proposition. Even on a weekly or monthly basis, moving dozens or even hundreds of securities into and out of a portfolio or, worse still, multiple portfolios is a costly, demanding task: institutional-sized equity trading and settlement remains cumbersome, even when highly liquid stocks. For the taxable, the cost of rendering to Uncle Sam his share should not be ignored when considering portfolio turnover, particularly when the differential between the short-term and long-term capital gains rates may be as much as 23% for some. When it comes to taxation of investment gains, a little patience now goes quite a ways.
Given these hard truths about the costs of rebalancing, combined with our firm’s average holding period in the 2+ year range, we pushed our simulation to the Bloomberg system’s limit, rebalancing once per year. We anticipate running these tests for 2 or more years in the future, but for now, one year will suffice (and it is double the average holding period for an NYSE stock these days, so it is Methuselahn by comparison).
Portfolio Weighting : Next, the backtester must decide whether the theoretical portfolio is to be equal-weighted or market cap-weighted. In other words, will all stocks that pass the screen be held in equal amounts, or will the portfolio be skewed towards the biggest and, presumably, most liquid stocks? We chose the latter, market cap weighting for a couple reasons.
First, we want our “map” to be as useful as possible as it does us little good to find stocks we can’t actually buy. And just to make sure, we also set a minimum market cap level of $1 billion, which acts as a hard limit on the minimum size company we will initially buy into in our actual portfolios. Second, market cap weighting overcomes the problem that equal-weighted portfolios have a higher percentage held in smaller market cap stocks, which have had a historic tendency to outperform larger cap stocks.
But, you may ask, aren’t you looking for criteria that help performance or preserve capital over time? Yes, but we want to consciously screen using criteria we can manipulate and analyze, rather than obscure such results in the structure of the backtest itself. Thus, we market cap weight the backtested portfolios and remove the smaller market cap companies from our sample in order to ensure our “map” can actually provide us with some practical understanding of how our criteria have broadly performed over time.
Lastly, as we are clients as well as practitioners, we have a financially-meaningful interest in results which can inform us, positively or in the negative, about our ongoing search for profitable investments. Theory is nice, but practice pays the bills.
Single Factor Price Backtests : With those caveats and hedges in mind, what did we learn from the single factor price portion of our backtesting experiment? Does discriminating on price alone able to produce out-sized returns versus a reasonable benchmark?
A Tale of Two Eras : As you will see on the three single factor screens below (Price/Book, Price/Earnings, and Price/Free Cash Flow), the past decade was a tale of two eras: pre-2007 and post-2007. While each of the screens proved successful in beating the benchmark (we chose the MSCI All Cap World) over the decade, the vast majority of the overall outperformance of the screens occurs before 2008 and very little if any outperformance is delivered after. This is highlighted in the “Active Return” component on the lower left hand corner of each screen grab. The green bars indicate the screen is outperforming the benchmark in that particular year, while a red bar indicates the screen in underperforming.
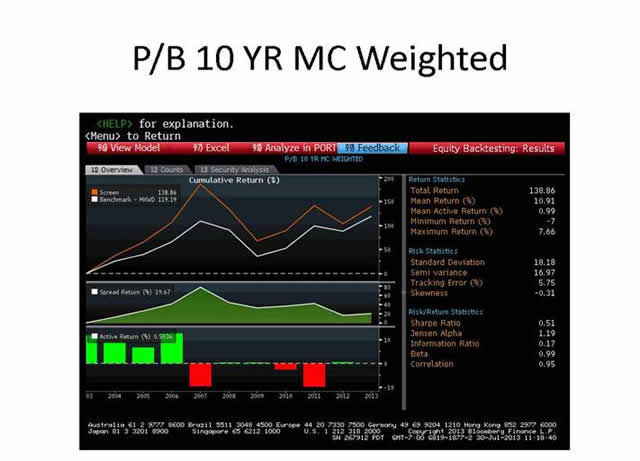


What is notable for us are not the exact metrics displayed in the three price-driven models, but the sudden change in fortunes for these price screens that occurred in 2007: from outperformance to underperformance. To see this effect, look at the “Active Return” section in the lower left hand corner of the three graphics above. Of course, just about nothing worked for anybody on the long-side of the market (whether bonds, stocks, real estate, commodities, or pure cash in the case of one money market fund) starting in August 2008, but it is noteworthy that the fall of purely price driven purchases starting in 2007 predates the problems encountered in the depths of 2008 and 2009.
A Single Year of Performance Made a Big Difference, Even for a Long-term Strategy : Referring to the P/FCF price screen grab above, note how 2006 accounts for almost all of that particular screen’s outperformance over the decade. Miss that year and you’ll have missed out on the benefits of employing a disciplined and consistent approach to price. It does not seem possible that a single methodology could outperform in all market conditions, but it does appear to us that soundly reasoned and tested metrics may produce enough outperformance over brief periods, while “holding their own” in others, to produce satisfactory performance over meaningful medium and long term periods.
Fewer Holdings Meant Better Performance : We believe that one of the reasons that these single-factor price-driven screens performed better before 2007 than after is the dramatic increase in number of backtested portfolio holdings which occurred over the period. For example, the Price/Earnings below screen gleaned 230 holdings in 2004, almost quadrupled to 981 in 2008, peaked out at 1,105 in 2012, before settling in at 852 for this year.
It is mathematically logical that the greater the proportion of benchmark holdings in a portfolio, the more difficult it is for that portfolio to beat the benchmark. As noted by Gilbert and Sullivan in their comic opera, The Gondoliers, “when everyone is somebody, then no-one's anybody.” In the case of the P/E screen above, when the theoretical portfolio holds 1,105 stocks of $1 billion in market cap or more and the benchmark holds 2,024 stocks in which 90%+ are $1 billion in market cap or more, then “no-one’s anybody” and there is a very significant overlap and, therefore, very similar performance, i.e. little chance for outperformance.
Consequently, our backtested results of single factor models focused solely on price tell us that there must be a certain amount of dynamism, (dare we say judgment?) in the setting of the price criteria as markets rise and fall over time in order to prevent the portfolio from ballooning into the benchmark. By setting the criteria at an absolute level, at those times when the market becomes cheap en masse, those naïvely screening for price find their portfolios flooded with too many holdings with the inevitable dilution of returns.
Multi-factor Price and Quality Backtest : Having noted our observations on price-driven screens, we then created a screen for backtesting which combined price, (in this case, P/FCF) with quality (5-year average ROE). Balancing ourselves along the tightrope of Bonini’s Paradox (not too complex, not too simple), as well as seeking to produce results which might inform us in our daily task of managing real portfolios of stocks, we again ran the backtest for a decade, set a $1 billion market cap minimum, used market cap weighting, and annual rebalancing. Here is what we drew from our multifactor “price and quality” backtesting experiment:
More of the Same – A Tale of Two Eras, Single Years Matter, and Fewer Holdings are Better : As with our single factor backtesting, the performance of the multifactor screen was sharply divided between pre- and post-2008, producing impressive results in the front half of the period and struggling in both scale and consistency of outperformance thereafter. However, by adding quality to the screening, you can see from the multi-factor screen grab below, 2007 and 2008 were much less traumatic for the quality portfolio versus the price-driven screens, as you can see from the “Active Return” bar graphs on each of the graphics.
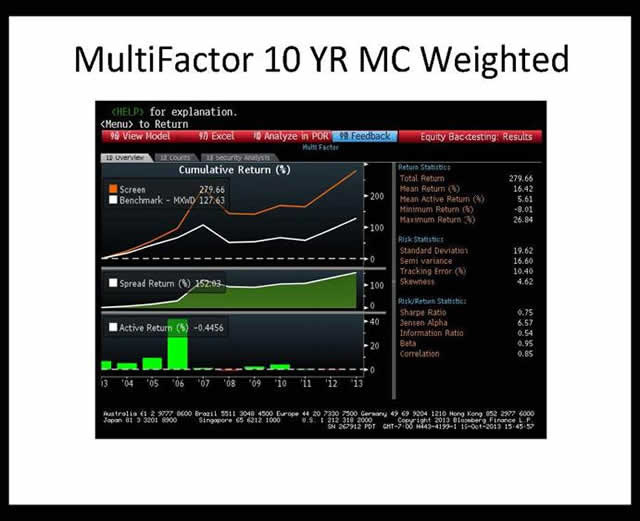
As with the single factor “price” screens, with “quality” added, over the decade the overall outperformance for the multifactor screen relied heavily on single years, such as 2006, to overall performance for the decade, though the swings, both positive and negative, were much less pronounced when “quality” was introduced into the criteria.
And lastly, the price and quality portfolio, like the purely price-driven screens, performed better in years with fewer holdings versus the higher holding count years. Indeed, over the whole period, the number of holdings from the price and quality portfolio started at 120 in 2004, never rose above 500 holdings, and ended at 286 holdings, far below the purely price driven backtests.
But Quality Makes a Big Difference : However, while in many ways, the price and quality portfolio shared some performance characteristics with the price-driven portfolios, the scale of outperformance achieved by adding quality to the criteria cannot be ignored. Whereas the single factor price screens achieved total outperformance over the decade in the 25% to 60% range, the multifactor price and quality screen produced total outperformance in the 150% range. In no way does this mean this relationship would hold going forward, but it makes intuitive sense to use that weeding out low return, high leverage companies from the mix must sure be good insurance against times like 2008 when credit dried up and, as Warren Buffett would say, the tide went out and the skinny-dippers were exposed.
By adding a minimum 15% 5-year average ROE and a maximum 66% debt to equity limit to the P/FCF screen over the past decade, it appears that we accomplished two things which helped the performance: first, by holding down leverage while insisting upon attractive returns on equity, we excised all the highly leveraged stocks from our resulting portfolios and thus were not holding them during a period which punished the highly leveraged, and, second, it also reduced the number of holdings in the theoretical portfolios, thus preventing the portfolios from being flooded with names as prices fell, thus diluting returns.
You can see this effect in the Multifactor graphic above: 2007 and 2011, which were negative or “red bar” years in the P/B, P/E, and P/FCF single factor screens, were positive or flat in the Multifactor price and quality backtest. This matches with our own experience in as much as outperformance is as often about not losing as much money in down years as it is about outperforming in bouyant markets.
Does this prove that insisting on quality at a cheap price always works? Clearly not, and that is not our goal: the past 5 years have not been easy for active, fundamental investors of all varieties, including ourselves, and our backtests show that disciplined, thoughtful investing has had a hard time putting distance between itself and the mass of the heaving, macro-driven global stock markets. The rise of exchange traded funds (“ETFs”) and the injection by central banks of trillions in currency over the past five years has undoubtedly added a new dynamic to global stock investing.
But we do not, in this process of testing our core criteria for obsolesence or efficacy, see evidence that profitably investing in companies which have higher returns on their unlevered capital and which trade at modest multiples of their profit or cash flows is in any way a thing of the past. We anticipate a reduction in central bank liquidity injections over the next 1 to 3 years, signaling a return to more fundamental-driven stock pricing, and that ETF’s, while here to stay, have limits to their utility and ability to capture pricing opportunities. As such, we anticipate that among the fallen who will be restored over the next few years, you will also find patient, price-sensitive, quality-seeking investors.
© Neosho Capital