To the brink they went and a “deal” was had. I don’t know if I call it much of a deal – I kind of feel like I’ve seen this B movie before. I could go on but that would put me in the same stature as the talking heads on the left and right news channels that prophesize to their viewers without regard for the rest of us. That said, one quick digression.
It’s no secret our society wants to know who won and who lost. We, including yours truly, are obsessed (or highly interested) to know if our team won, who won the Series, Super Bowl, food fight, new job, etc. Hum along, “We Are the Champions.” Last week, it was the Democrats who were pinned the victors – now comes the need to do some real work. Let’s hope sanity and centrality prevail. Alan Dershowitz, who was on Fox News (yes, really – ok, he was promoting his new book), offered a very appropriate response to an interviewer’s question about his having strong negative feelings about an extreme left group. Dershowitz pointed to his being a centrist democrat and that he can agree and disagree with with his centrist republican counterparts for the sake of compromise, recognizing relevant points and moving forward but it is the extremists on either side that are screwing things up. Sure hope some of the elected officials were watching.
As it relates to the dark comedy of the past few weeks, in the end, no one won. While some politicians point to the 16 day shutdown as the latest cause for our economic malaise and the severe damage caused by the delay, this is nothing more than political posturing. Look at the data – jobs, income and poverty (despite very favorable monetary policy). The US Department of Agriculture released some data on Friday. Hey Congress and Mr. President, 39 States have seen Food Stamp Participation (not the labor force or jobs) grow from July 2012 to July 2013. Get back to work and focus on what really matters – fixing our economy.
Best and Worst – Winners and Losers, It’s All the Same
On October 12, Barron’s ran one of their “Best & Worst States” articles entitled “Munis on the Mend.” Actually, worth a read if you have not yet seen it. In reading the “Best & Worst States, Munis on the Mend” I found the focus on pension and outstanding debt to be meaningful but believe it ignored other critical information around the economic well-being of the States. Pension liabilities are nothing new and, as was noted in the article, many States have already taken steps to begin to address plan construct (would be nice to see the same done about a more realistic discount rate). The economic well-being of a State must be a critical factor in any analysis of the “Best and Worst.” Without a good or improving economy to fill the tax-receipt coffers, how does a State make its ARC?
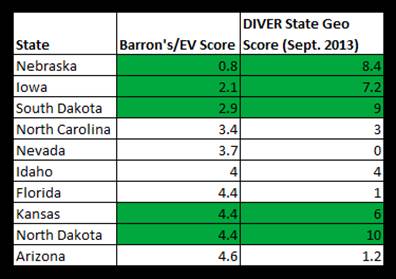
We compared the “Best and Worst” as reported by Barron’s against our Geo Score1, a measure of the relative economic well-being of each State. The table below highlights the top 10 States as reported in the article against the Geo Score. I have highlighted the five States that scored highly in the article and score well using our Geo Score. In other words, States with “better” debt and pension liability and a better than average relative economic condition – “Munis on the Mend.”
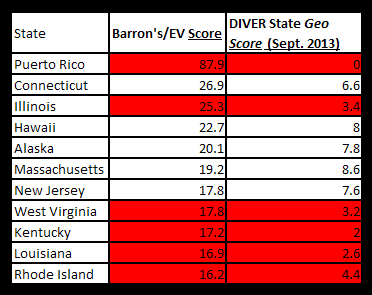
Highlighted below are the 10 States that scored worst in the article and scored poorly using our Geo Score. These represent States (and the Commonwealth of PR2) with the “worst” debt and pension liabilities and a worse than average relative economic condition. States that score above average for our Geo Score should have a better ability to manage through their debt and pension burdens.
I am not suggesting use of the Geo Score is the answer. I am suggesting that any analysis of how a State is doing, which is “Best & Worst,” requires a view beyond pension liabilities and debt outstanding, an added dimension that contemplates the most recent economic and demographic data to get a better sense of the totality of circumstances facing that State. As we caution so often, look beyond the headlines and limited (and oftentimes, in the muni space, dated) data points. Focus on current data (we suspect that the data used in the article reflects FY 2011 v FY 2012) and include an analysis of the data driving the economic well-being of the geography of interest.
More to come on the subject. Using our Pension database, I will also be looking at changes in funded ratios year on year and ARC as a percent of general fund revenue.
Another week out and about for the team. Tim will be in Alabama presenting at BBVA Compass’ event (after a date at Talladega) while Gregg and Ralph will be in our nation’s capital at the NSCP event.
Have a great week.
Gregg L. Bienstock
CEO & Co-Founder, Lumesis, Inc.
Data Released Last Week:
As a result of the government shutdown, certain data was not delivered by our sources. To the extent data has been made available or is being made available, it will be in the DIVER platform for our clients, as always, within 24 hours of release from the source.
- Food Stamp Change, State, July 2013
- Weekly Initial and Continued Jobless Claims, State, 10/5/2013
- UPDATED: Bankruptcy Filings - Issuers, State, County, 2013
- UPDATED: Default Filings - Issuers, State, County, 2013
1 The Geo Score incorporates a series of data sets from the housing, income and employment data categories and is updated monthly. In other words, primary drivers of State tax rolls, tax-receipts and expenditures. Our scale is a simple 0 to 10 with 0 being the bottom and 10 being tops.
2 Please note: Puerto Rico does not have a Geo Score due to limited data. For the data we have, it scores worse than all other States.
© Lumesis


