I am confident that some type of deal will be reached to avert a default. And, let’s keep in mind that, according to the CBO, the 10/17 deadline is really just a deadline to start making decisions about what to pay with the remaining $30 or so billion as they project another one or two weeks before the “day of reckoning” when there is only enough money to pay about 70% of the government’s bills – which bills to pay. Sounds like a decision one needs to make when they spend beyond their means. Instead of a simple band-aid or another sequester, perhaps there is hope that our leaders will actually formulate a plan for economic growth, something long range…
Whether it is the prospect of a default, changes to revenue streams or expenses, or the Fed easing, I thought it was time to revisit the housing market. I am then on to an interesting report from the MSRB around financial disclosures and conclude with a look at some “non-essential” stuff.
Let’s Talk About Housing
In all the banter about our government’s dysfunction, not a lot has been said about the housing market and how it might respond to a default, the Fed ending its bond-buying program, raising rates or all three events. Simply put (and I’ve said this before), the housing market is not back to where it was pre-recession and, with the prospect of one or two major interest rate influencing events on the horizon, I am concerned that municipalities reliant on property tax receipts and other housing market related income will suffer.
Let’s start with Housing Prices and, using data from the FHFA for the 2nd quarter of 2013, we find that 1,313 counties (out of over 3,100) have higher Housing Prices than one year prior. What happens if rates pop (rhetorical question)? As we all know housing prices drive assessed values which drive property tax receipts.
Staying with housing and some seemingly good data around the housing market – at least as far as Delinquencies. Only seven States saw the Delinquency Rate rise or stay flat, a far better result than just six months ago.
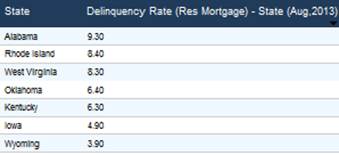
DIVER Analytics, Filter Module; LPS
However, 36 States still have a Delinquency Rate north of 5%.
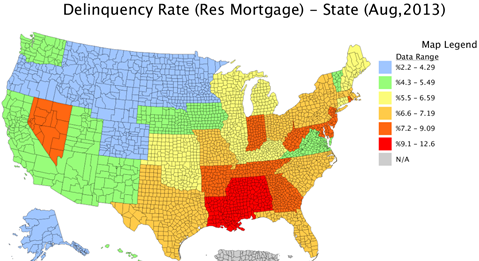
DIVER Analytics, Map Module; LPS
Looking at Foreclosure Rates, 15 States have Foreclosure Rates equal to or worse than one year ago and, of the group defined below, only Delaware has a Geo Score greater than five.
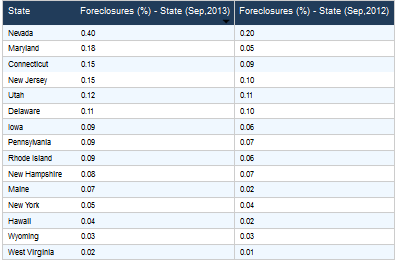
DIVER Analytics, Filter Module; RealtyTrac
Drilling down a bit further we find that, at the county level, things are not as rosy with 1,580 counties having Foreclosure Rates equal to or greater than one year ago. Of this group, 864 counties have a Geo Score greater than five – meaning their economic well-being is better than at least half the counties in the US and, perhaps, are better situated to withstand a shock to the system.
The point is twofold. First, we are still not out of the woods and one needs to seriously consider the reliance of municipalities on property tax receipts, the assumptions used in planning regarding those receipts and the impact of the housing market taking steps backward. The second is that, as you evaluate positions you hold or consider, focus on the details – the rising tide is not including all ships.
Stale Financials -- MSRB Continuing Disclosure Report on Financial Filings
On October 8, the MSRB released their Continuing Disclosure Report Supplement: Timing of Annual Financial Disclosures. The results of their comprehensive review of submissions since 2010 confirm our more limited review of financial filings over the same period, albeit for a more concentrated audience (50 States and 50 largest cities).
The tables below, the data of which is from the MSRB report, summarize the results for the filing of annual audited financial statements and annual financial information, specifically the average number of days after their fiscal year end that a filing was made. The one year data excludes any filings outside the 12 month period and the two years statistics includes filings that were made within two years of the close of the fiscal year (captures certain filers that took longer than 12 months to file – yes, they exist).
Annual Financial Statement Submissions
|
2010 |
2011 |
2012 |
2013 (thru 6/13) |
|
|
1 Year |
202 |
202 |
200 |
204 |
|
2 Years |
229 |
231 |
231 |
231 |
Annual Financial Information Submissions
|
2010 |
2011 |
2012 |
2013 |
|
|
1 Year |
187 |
185 |
188 |
194 |
|
2 Years |
199 |
199 |
200 |
206 |
The MSRB’s results are not news to most of you but they do reinforce several points we have made around the municipal market. First, while transparency is the buzzword and all profess to want more, these statistics highlight a major issue. We have stale financial data that, in many cases, is produced but once per year. Unfortunately, unlike the equity market, we see less “market discipline” around the issue as issuers who are less than transparent do not necessarily see a negative impact (compare to a company that files financials late and their stock price takes a beating). The issue of timely financial information to market participants needs to be addressed.
A crazy idea (which I am certain will generate some email responses). As Congress grapples with the debt ceiling, spending and tax reform (let’s not forget about that one although I am realistic and don’t believe anything meaningful will be done until after the elections), perhaps a little prod to some issuers might help. To maintain tax-exempt status for new issues, the issuer must submit annual (dare I suggest quarterly) financial statements in a computer-readable format within 90 days of the close of the fiscal year. Unreasonable? Not for public companies. If you have the ware withal to issue tax-free debt, it seems reasonable to require the issuer to provide investors with timely and accessible financials.
Second, until a solution is found around providing market participants timely financial information, market participants need to access and utilize economic and demographic data. What drives tax rolls, tax receipts and spending? Data touching on employment, housing, income and other data categories. These data come to the market on a weekly, monthly, and quarterly basis and, in most cases, are from objective sources – just the facts. In a time when the municipal market is experiencing fiscal stress many have not seen before (Detroit, Illinois, Puerto Rico, etc.), accessing data, managing portfolios, understanding the economic well-being of geographic areas is more critical than ever.
“Non-Essential”
Last week, I touched on my concern for those Federal workers furloughed and need to revisit the point for a brief moment and then hit on a favorite whipping post of mine. “Non-essential” is defined as not necessary or essential. So, if something is non-essential is it, by definition, not needed? Either the media and politicians (by their inaction) have insulted a few hundred thousand people or our Federal workforce is overstaffed. Couldn’t resist.
October 5 came and went and not many folks seemed terribly upset that something was missing. What was missing? The first Friday employment report. This commentary has routinely cautioned about the overreliance on a report that has a limited survey group and is refined a few weeks later when more and better data is collected. Perhaps Congress has found some savings! More “non-essentials.”
Have a great week.
Gregg L. Bienstock
CEO & Co-Founder, Lumesis, Inc.
Data Released Last Week:
- Weekly Initial and Continued Jobless Claims, State, 9/28/2013
- Foreclosures, County and State, Sep 2013
- UPDATED: Tax Rates and Rankings, State, 2014
- Delinquency Rate (Res. Mortgage), State, Aug 2013
- UPDATED: Bankruptcy Filings - Issuers, State, County, 2013
- UPDATED: Default Filings - Issuers, State, County, 2013
© Lumesis


