Driving home last week, the plight of furloughed Federal employees was on my mind. How could our elected officials in DC accept their pay for not doing their jobs while hurting folks that want to work but are told not to because the men and woman not doing their job (and still getting paid) shutdown part of the government? I was heartened to learn that Congress was going to take action but quickly realized that the “fix” paralleled the stupidity that got us into this mess. The legislation ensures that all furloughed employees will be paid for the furlough period. Don’t get me wrong, I am happy for these people. But come on, if we are going to pay people, shouldn’t they work? Also, when they work, they drive, ride public transportation, buy lunch, etc., you know, drive the economy.
Who knows, maybe Speaker Boehner’s pronouncement that he will not let the government default (you know, debt ceiling crisis coming soon to a news show near you) and the President cancelling his Asia trip should give us hope.
As the follies in DC continue with the potential for a solution that involves changes to the way the Federal government spends our money, I thought it would be worthwhile to explore the possible impact of the Federal Government shutdown, or for those with a longer-term view, a general decrease in future federal spending. Below, is a look at States most and least reliant on Federal Spending, the Geo Score of each and Geo Score trends.
Most Reliant on Federal Spending as a % of State’s Revenue :
|
Fed. Funds to States as % of Revenue (2012) |
Geo Score Sept. 2013 |
Geo Score Trend |
|
|
Mississippi |
83.51 |
0.2 |
1 |
|
Rhode Island |
51.61 |
4.4 |
4.8 |
|
Arizona |
50.78 |
1.2 |
8 |
|
Oklahoma |
50.41 |
4.6 |
4.4 |
|
South Carolina |
49.46 |
0.4 |
6.2 |
|
Louisiana |
49.22 |
2.6 |
1.6 |
|
Tennessee |
48.82 |
2.8 |
2.2 |
|
South Dakota |
47.94 |
9 |
8.8 |
|
New Mexico |
47.61 |
1.4 |
0.2 |
|
Colorado |
46.93 |
6.4 |
9.2 |
Source: State CAFRs, NASBO, Recovery Act Transparency Board; Lumesis.
Of the States most reliant on Federal Spending as a Percentage of Revenue, South Dakota and Colorado are best situated to withstand the impact of a Federal government shutdown or changes to government spending. States of concern include Mississippi, New Mexico (high reliance, low scores), Louisiana and Tennessee (high reliance, low score, poor trend). States within this group that may suffer in terms of reversing a relatively positive trend include Arizona and South Carolina.
Least Reliant on Federal Spending as a % of State’s Revenue
These States are the ten that are least reliant on Federal Spending as a percentage of their revenue and at least risk of suffering an impact from the government shutdown or changes to Federal Spending.
|
Fed. Funds to State as % of Revenue - (2012) |
Geo Score Sept. 2013 |
|
|
Connecticut |
12.15 |
6.6 |
|
Illinois |
18.52 |
3.4 |
|
Washington |
21.30 |
5.6 |
|
Alaska |
25.29 |
7.8 |
|
Hawaii |
26.85 |
8 |
|
Massachusetts |
27.31 |
8.6 |
|
New Jersey |
27.64 |
7.6 |
|
Ohio |
28.82 |
1.6 |
|
Virginia |
31.55 |
8.8 |
|
Minnesota |
32.08 |
8.2 |
Source: State CAFRs, NASBO, Recovery Act Transparency Board; Lumesis
It’s probably no coincidence that 8 out of the 10 States that receive the lowest level of Federal Funds as a % of their total revenue have a stronger than average economic environment (i.e. Geo Score of greater than 5.0).
Federal Government Employment as a Percentage of those Employed… (By Samantha Cohen)
As we watch the impact of the Federal government shutdown trickle to the State level, we take a closer look at the level of Federal Government Employment as a Percentage of the States’ Employed Population.
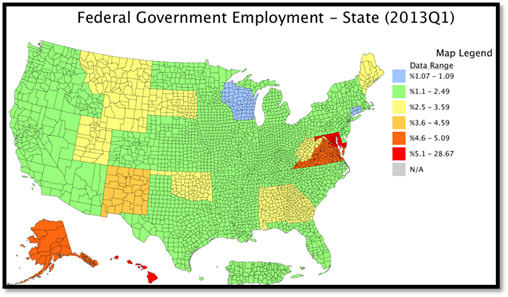
DIVER Analytics, Map Module; BLS
Washington DC, the shutdown epicenter, leads with a predictably high rate of 28.67% with Maryland trailing as a not-so-close second at 5.78%. The majority of states had federal government employment levels lower than 2.5% of their workforce (blue and green) with Wisconsin and Connecticut sharing the lowest level at 1.07%. For further detail, CNN provides a comprehensive list of offices and agencies that are affected until an agreement is reached: What’s Closed, What’s Open.
As the government shutdown and other follies continue, we will be watching closely to see how these events impact the DIVER Geo Scores of States, counties and cities.For a list of all State Geo Scores, please visit http://www.lumesis.com/our-solutions/current-scores .
Tax Collections and Collections Per Capita
Recent tax collections data, while for the most part positive, did see six States (actually four and DC and Puerto Rico) have a decline in Tax Collections on an absolute basis and Per Capita. The good news is none of these locations are in our top Federal Spending as % of Revenue States.
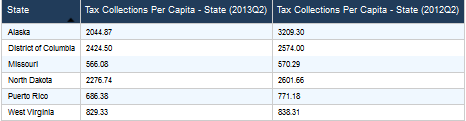
DIVER Analytics, Filter Module
Food Stamps – I mean SNAP (that’s what it is now called)
This next visual is not pretty – Food Stamp Participation Change for the period noted. Only blue, green and yellow are down – nine States.

DIVER Analytics, Map Module; US Dept. of Agriculture.
Just maybe this should be front and center in the national debate.
DIVER Database Note
The DIVER database is fully functional and up-to-date. To the extent data has been released from the sources from which we obtain data, the same is available for our clients. To the extent data has not been released due to the government shutdown, we still maintain the historical files and the same are accessible. We remain committed to delivering data to our clients within 24 hours of release from the source.
For those of you heading to the BDA conference Chicago, please stop by our booth to say hello.
Have a great week.
Gregg L. Bienstock
CEO & Co-Founder, Lumesis, Inc.
Data Released Last Week:
- UPDATED: DIVER Geo Score, State, County and Place, Current & Trend, Sep 2013
- Medicare Hospitals #, Oct 2013, State, County
- Hospital Ownership %, Oct 2013, State, County
- UPDATED: Fed. Funds Received, State and County, 2013
- Philly Fed Leading Index, Aug 2013, State
- FEMA Disasters, County, YTD 2013
© Lumesis


