Tidbits Foreclosure, BK Signs and John Mauldin's Unrealistic Expectations
Some tidbits to start and then on to an outstanding guest commentary from the renowned John Mauldin. Our tidbits focus on Foreclosures and some insights around our review of some bankruptcy warning signs published by S&P Capital IQ. Our guest commentary, “Unrealistic Expectations” (I might have called it “Unrealistic Assumptions”), focuses on the daunting reality of underfunded pension plans. Interestingly, one of John’s focal points is around the importance of using realistic discount rates (he makes a fairly compelling case for his suggested number) and normalization of assumptions. Recall, this is precisely the approach we suggested in our September 9, 2013 commentary.
Foreclosures
The latest Foreclosure data released by RealtyTrac offers a glimmer of hope. A run through the DIVER Analytics’ Filter Module shows that only 883 counties have a higher Foreclosure Rate than one year ago. A look at the States offers similar results – fourteen States have a higher Foreclosure Rate than one year ago. Caution -- this is but one indicator relative to housing and, as always, we suggest you contemplate the more complete picture and look forward to the House Price Change data (last quarter’s wasn’t terribly positive) and the August Delinquency Rate, both of which we expect shortly and will report on.
Bankruptcy Warning Signs – Somebody Else’s – and Geo Score Overlap
Last week, we came across S&P Capital IQ’s list of “10 Warning Signs of Potential Municipal Bankruptcy” and decided to test some of what they highlight as “Economic Credit Risk Factors.” We ran our analysis using the below factors at the county level and identified 29 counties that met S&P’s economic criteria as we understood the same.
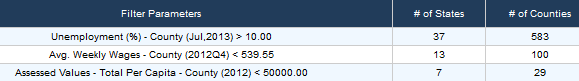
DIVER Analytics, Filter Module; BLS, BEA and Assessor’s Offices
Using the DIVER Geo Score (which contemplates factors across the unemployment, housing and income data categories) against the above, we find that all 29 counties score less than 2. Using a Geo Score of less than 1, we find an overlap for 22 of the 29 counties. Finally, using a Geo Score of 0, we find an overlap of four counties: Telfair, GA; Wilcox, GA; Humphreys, MS and Noxubee, MS.
They offer other criteria (some objective, some subjective) around “Management Credit Risk Factors” such as “late financial filings” (not defined), “high degree of turnover” (not defined and unsure relative to what) and “lack of willingness to support its debt” (hmm). On the “Debt Credit Risk Factors” part of the equation, they highlight “Debt Service representing > 25% of expenditures” (one might also consider Debt Outstanding Per Capita ) and “Unaddressed exposures to large unfunded pension and OPEB obligations.” On this latter point, aside from the lack of clarity (“unaddressed”, “large”), it is hard to ignore the reality that virtually every municipality has an unfunded or severely underfunded OPEB obligation. Moreover, they seemingly ignore the fact and amount of the Unfunded Pension Obligation, instead focusing on “unaddressed.” The importance of this last point, the assumptions used to determine the same and some realistic observations around States that have taken steps to address their unfunded pension obligation is a large part of our guest commentary. Before turning it over to John, here is a quick look at a few data points on the subject.
- 32 States have a Pension Plan Funded Ratio of <80% for 2012 – see the below map where blue represents 80% or greater. Remember as you read our guest commentary, the below is based on assumptions used by the Plans themselves. After reading John’s commentary, you may want to adjust certain assumptions and perform your own analysis of State and City pension plans. If so, let me know. We maintain a database for 225 State-sponsored plans and more than 500 city-sponsored plans (this last number will rise to over 600 once reported.
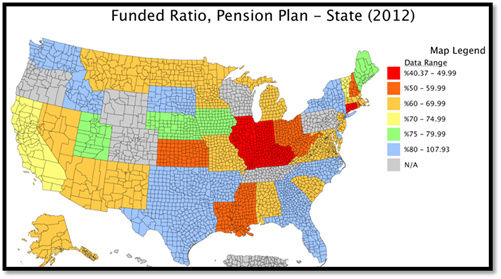
DIVER Analytics, Map Module; State CAFRs.
Our Guest Commentary
In the past, I have written about pension liabilities and concerns about what the number might be if we simply used some realistic assumptions. John Mauldin has done that and a bunch more. To whet your appetite:
Current official reporting suggests that States have funded 73% of their pension liabilities. The fair-market approach used by Moody’s and GASB suggest that funding is at 39%. The difference is almost entirely due to the assumptions one uses about the discount rate for future expected returns.
Referring to Illinois, Mauldin notes:
The State of Illinois has set aside $63 billion to pay future benefits. But between now and 2045 they’re going to have to pay out 10 times that much -- $632 billion… Total state revenues for Illinois were $33 billion for fiscal year 2012. Let’s see if we can find a politician to propose that they take 25% of the budget every year for the next 10 years to reduce their unfunded pension…
I am pleased to present to our readers an excellent Thoughts from the Frontline by John Mauldin.
http://www.mauldineconomics.com/images/uploads/pdf/130907_TFTF.pdf
Have a great week.
Gregg L. Bienstock
CEO & Co-Founder, Lumesis, Inc.
Data Released Last Week:
- Weekly Initial and Continued Jobless Claims, State, 8/31/2013
- Foreclosures, State and County, August 2013 Exports Total (Monthly), State, July 2013
- UPDATED: Bankruptcy Filings - Issuers, State, County, 2013
- UPDATED: Default Filings - Issuers, State, County, 2013
© Lumesis


