The long road to normality
Year-to-date end-August the strategy performed well with a gain of 22.2% vs. 14.6% for the benchmark. During the month, the index “tumbled” 3.9%, partly out of fear of foreign military action in Syria and partly that central banks would cease printing money to hold down interest rates – commonly known as tapering. Even so, the portfolio held up in August, with a much lesser 2.4% fall, thereby further widening outperformance over the index to 760 basis points so far in 2013.
Equity market index returns and economic activity will gradually revert to normal. The last five years have been unique as governments struggled with the first ever global financial crisis and the meltdown of a record number of financial institutions. The previous 20 years were also abnormal: an uncontrolled global credit boom, encouraged by politicians, created twin illusions of wealth for all and record economic growth. The important outcome for equity investors is that returns are likely to normalise; over the long run these have averaged between 7% and 9% p.a. and may perhaps be lower across most markets as the great credit bubble is slowly unwound. Yet investors should be very happy with an index 6% return p.a. (and hopefully, active stock picking will continue to produce better). This is clearly preferable to the zero capital gain between 2000 and 2009, although will disappoint some investors relative to the recent but unsustainable near 30% gain in global equities from mid-2012. Moreover, world index returns look set to beat bond returns easily, as a grinding long-term bear market in government bonds has commenced.
Sub-normal economic activity, yet higher equity market returns, are the inevitable consequences of governments wrestling to avoid the considerable potential for a debt crisis – for it has not gone away. Lower private sector borrowing has usually been compensated for by rising government debt. Of the world‟s 33 leading economies, 27 now have debt-to-GDP ratios over 130%, which until recently was considered a disaster level. Seventeen of these 27 have ratios between 200 and 300%, whilst in 18 countries debt ratios have continued to rise. Hence the almost schizophrenic juggling act by central banks - trying to stimulate private sector growth whilst preparing for the slow removal of giant support programmes.
The reality is that this withdrawal will take many years. In America, the effective interest rate paid on the entire stock of debt is at a 50-year low; thus even a minor uptick in interest rates increases its cost significantly. Homeowners have seen mortgage rates fall steadily since 1982 (chart 2, p. 4) and it is difficult to see how costs can go lower, so, as rates rise household expenditure (along with real wages) must remain subdued. The current excitement generated by „recovery‟-be it improving Purchasing Managers‟ Indices or previously contracting economies returning to modest growth-is overdone. Many had fallen to such moribund levels that simply by failing to contract further, a statistical upturn was inevitable.
Index returns of 6% and global growth of 1.5% to 2.5% p.a. is a very bullish result from such an extreme crisis. Two events could destroy this. The first risk is longer term: that the rate of reduction in government support programmes is too rapid. Many business and national bond markets remain over-leveraged (such as emerging markets); capital expenditure and recovery would reverse rapidly. Hence Bedlam‟s consistent view that central banks will be both tortoise-like slow in reducing their support and simultaneously channel new funds into other areas. The second risk is more immediate: China‟s extraordinary debt problem (chart 1, p.4). China avoided the financial crisis by flooding the sector with new money and forcing banks to on-lend even more to ramp up the economy, resulting in one of the most heroic capital misallocation episodes in history. China cannot escape its problems and a financial crisis is inevitable, but so complex are the issues that the many consequences are impossible to predict. However, as this crisis unrolls, so the dangers of multiple global shocks accelerate.
Yet these two obvious risks may be priced largely into market valuations. In most leading markets, the Cyclically Adjusted PE (CAPE) commencing 2006 is reasonable. For the world index end -August it was 18.6x vs. the 10-year average of 22.5x; Europe 13.9x (vs. 21.0x) and Japan 23.1x (vs. 54.7x). Most indices are at least one standard deviation away from their CAPE averages – the standout being America, which at 23.7x is at the long term average (and historically, index investors have always lost money in succeeding years from such a level). Other indicators also suggest there is reasonable value globally: prospective PERs are at the lower end of their ranges and in some cases extreme - such as Emerging Europe, Middle East and Africa (EMEA) at a mere 7x. Yields are also looking anomalous. Developed markets are now in the top quartile of their 20-year range at 3%, Emerging Markets 3.2% vs. a long-term average of 2.4%. Again the exception is America. Investors have been brainwashed by companies to believe that dividends are for wimps and that real men do buybacks - hence that market‟s mere 2% yield. This will change because the buy-back fashion is waning. Although the rate of growth in profits is slowing, nevertheless as economies and markets gradually return to normality, equities now look reasonable value. Stock picking should enhance the likely 6% p.a. return.
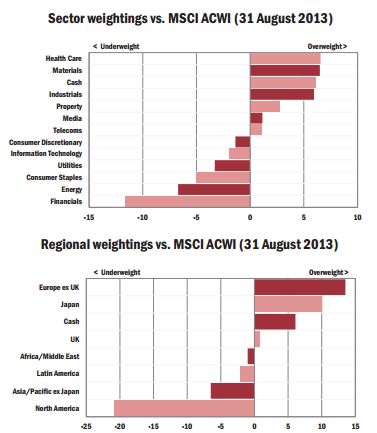
The portfolio‟s outperformance for the month and year to date was a function of stock and sector selection, which accounted respectively for approximately two thirds and a third of the outperformance. On a sector basis, materials proved the best, and especially the two silver miners, Fresnillo and First Majestic. Their prices had previously been pummelled as the silver price fell from $32 per oz. in January to $18.5 in June before recovering to the current $23.5. A second important reason was the upturn in Japan. After its near 50% run (in yen) from November 2012 to April 2013, the widely expected inevitable reaction set in. Now this correction has started to reverse; hence three of the top ten best performing stocks were in Japan and the portfolio‟s current 18% weighting, with a deliberate concentration on domestic companies, benefited as a consequence.
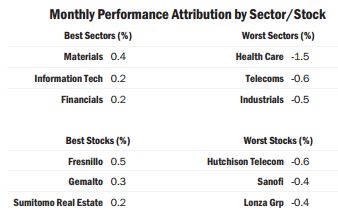
As is always desirable, trading was minimal, with a single outright sale of the potash miner Mosaic. This was flagged in last month‟s Bulletin. There were also some part sales. These included a further reduction in the holding in the biotech company Celgene, which has performed well, driven by its own dynamics and high optimism across the whole sector as shown by a record number of IPOs. Further gains were also taken to reduce the large weighting in Chart Industries. This was both close to target price and of concern due to the likelihood of it failing to hold its market share in China where it has a lead position in de-gasification (using LNG for transportation). Capex availability and approvals for such projects may diminish. Long-held Hutchison Telecom was the worst performer. Irrational in that its results “miss” was on overoptimistic forecasts; investors have also seemingly forgotten that not only are profits second-half loaded, they are also heavy dependent on new mobile phone launches. These will accelerate towards the end of the year. With the results season now largely over, there were no major unpleasant surprises in the portfolio despite many companies missing their own forecasts. The percentage of misses in America was only 18%, but in Japan 33%, Europe 39%, and Asia ex-Japan 41%. In South Korea, an amazing 63% of all results missed official company forecasts. The presumption must be that Asian companies especially are underestimating the impact of a weaker yen and extent of slower demand in China.
Strategy remains more of the same: to avoid sectors and stocks like autos or heavy industry, where there are obvious problems such as overcapacity, weak demand, or dependency on private sector credit-fuelled consumption; then to focus on companies with low historic valuations and able to maintain margins and/or increase revenue. The theory is simple enough and has worked so far and long may it continue. Moreover, no-one knows how to value equities yielding 3% plus (provided their dividends are well covered by cash flow and have the scope to rise), as never before have central banks tried to hold short rates as close to zero as possible. They are certainly not wildly over-priced.
© Bedlam Asset Management