First Friday Review, Opportunity Knocks, Pensions and Geo Score Bottom 10
This week I go far and wide. Initially, we take a look at the relatively poor First Friday Employment Report (you know the one the media loves to harp on). We then turn to a quick look at what some view as a buying opportunity and wonder if it is really so. Hint: if you know the answer with certainty, please let all of our readers know. We then move on to revisit the latest Pension data and ask the question: what would these figures look like if some of our factors were normalized? We conclude with the August Geo Score for the States and the bottom 10 for the month and those that are trending the worst for the past year. We are working on some changes to our site where you will be able to access all Geo Scores whenever you like.
First Friday Report – I’m taking the bait. Can’t help myself. The past few months I’ve expressed some doubts and as recently as last week offered our sobering assessment of the employment situation. Today’s First Friday report missed expectations and pointed to some disappointing top line numbers. In fairness, as I caution giving this report too much credence when it is singing positive tones, the same caution is offered here. Lets start with the “expectations” of the experts and ADP’s prediction last Thursday – both were off by about 20,000 jobs to the negative. Add to that, the downward revision of jobs created for both June and July (sure hope the Fed wasn’t relying on this data when they told us all about tapering) totaling 74,000. The rate and number of folks employed – about the same – but what makes this even worse is the fact that the labor force participation rate is down to 63.2% - the lowest it’s been since the late 1970’s (before some of you reading this were born). Long-term unemployed (27+ weeks) is unchanged at 4.3 million and there are another 2.3 million who are “marginally attached (not in the labor force, wanted and were available for work and had looked for work at some point in the last 12 moths). Another way to contemplate this last point:
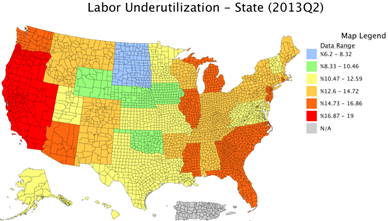
DIVER Analytics, Map Module; BLS.
Yes, this is the First Friday report but the most recent detailed data (cited in last week’s commentary) is in line with this report. What does this do to the Fed’s plans to taper? We’ll find out shortly.
Buyers See Opportunity – A recent Bloomberg Brief cited the buying opportunities some are seeing given the recent rout in munis. Citing MSRB trade data, they note that small trades (those less than $100,000) accounted for 85% of muni trades. Higher relative yields are seemingly driving behavior as folks place their bets on what the Fed’s purported bond-buying tapering will mean and if the economy is truly improving. While the yield opportunity may be present, one can’t look past the fundamental question of credit quality and how much the economy is improving. The other reality to contemplate is the Time of Trade Disclosure. With FINRA in the midst of their interest rate sweep (what is being communicated to advisors and the retail investor about interest rate risk), communication of material information reasonably accessible – including risks – is critical. Proof of that communication may be even more critical should rates shoot higher and prices decline further. Consider this understatement from a Financial Planner who has a client with $1.2 million of Puerto Rico bonds, “My client is not happy to see his portfolio drop.” In Municipal Market, Some Investors Fly First Class, WSJ, 9/5/2013. Sure hope he communicated the issue of interest rate risk.
Pension Data Update
This past week, the DIVER platform was updated to reflect Pension data filed though the end of last week. I am going to throw some important data your way and preface the same by letting you know the underlying individual plan and raw data is also available. I offer this because there are some factors the plans assume that may make you scratch your head – think discount rate compared actual returns and latest actuarial valuation to determine their ARC.
Let’s start with some somewhat generous assumptions about what may be unacceptable from a funding and ARC paid perspective and work our way to some not so generous assumptions. Funded Ratio 50% or less, ARC Paid for 2012 95% or less and, for good measure, a Geo Score of five or less. Only three States meet these fairly miserable criteria: Illinois, Indiana and Kentucky. You may ask, what about Puerto Rico? They have not yet reported their 2012 figures but you may as well add them to the mix. If we revise our data to a Funded Ratio of 75% or less and the same ARC Paid, the list grows (again, you may as well add Puerto Rico):
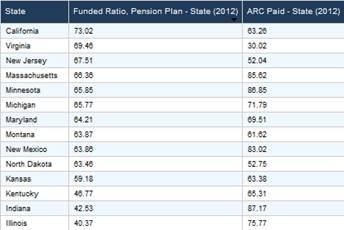
DIVER Analytics, Filter Module, CAFRs, Lumesis.
Of this group, New Mexico, Michigan, Indiana, Kentucky, Illinois and California all have a Geo Score of less than five. Here is the US map for your consideration.
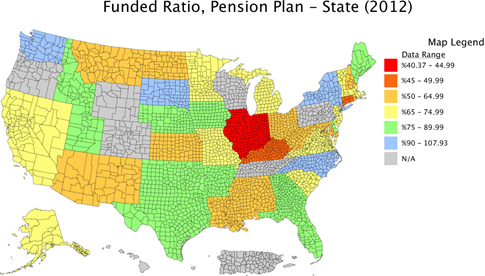
DIVER Analytics, Map Module, CAFRs.
Again, while the above results are instructive, “normalization” of some of the underlying factors may very well yield some interesting (disturbing) results that may surprise you. Would Funded Ratios be as reported if all plans were actuarially updated for 2012 and used a discount rate of 7%?
Food Stamp Participation
I round out this week’s commentary with a fairly simple visual and, while I had hoped for something better, the best I could do was make the map look nice. Unfortunately, the results are not as nice. Below I look at the Food Stamp Participation Change for the one year period looking back from June of this year. The good news is that the blue States/territories actually saw a decline (I count 12) the bad news is the rest of the country. More people are receiving Food Stamps than they were a year ago and more than ever.
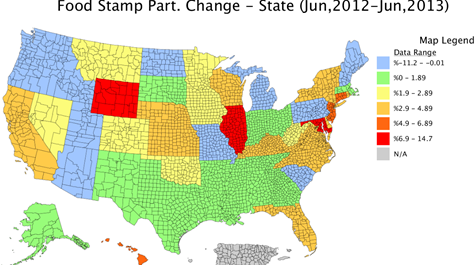
DIVER Analytics, Map Module, US Dept. of Agriculture
Geo Score
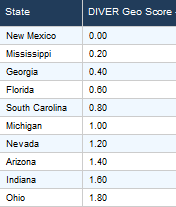
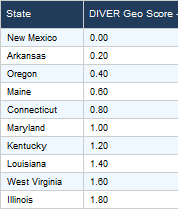
With the turn of the calendar, we provide our monthly update of the DIVER Geo Score. The Geo Score is available for all States, Counties and 300+ cities. Below are the current and trend scores for the bottom 10 States.
Current – Bottom Ten Trend – Bottom Ten
Have a great week.
Gregg L. Bienstock
CEO & Co-Founder, Lumesis, Inc.
Data Released Last Week:
- Food Stamp Change, State, June 2013
- Affordable Care Act Exchange Implementation, State, Aug, 2013
- Weekly Initial and Continued Jobless Claims, State, 8/24/2013
- Exports Total (Monthly), State, July 2013
- UPDATED: Special Event: Tornadoes, County, 2013
- Delinquency Rate (Res. Mortgage), State, July 2013
- UPDATED: Default Filings - Issuers, State, County, 2013
- FEMA Disasters, County, Aug 2013
- UPDATED: ARC as % of General Fund Revenue and Expenses, State, 2012
- UPDATED: Percent of ARC Paid, State, 2012
- UDPATED: Funded Ratio, Pension Plan, State, 2012
- UPDATED: Bankruptcy Filings - Issuers, State, County, 2013
- UPDATED: Default Filings - Issuers, State, County, 2013
© Lumesis


