Welcome back from your Labor Day weekend. This week we take a look at the employment data (pre-First Friday Employment Report) and try and find where there is Job Growth of any kind. We then take a closer look at Puerto Rico against the backdrop of some recent changes and comparative data, and close out with a look at the Affordable Care Act (aka Obamacare).
Show Me the Job Growth
Some telling employment data was released last week. Let me start by saying, I feel confident that the economy is truly improving given the revised GDP numbers (this month they were revised up after the prior months had been revised down) and that home prices continue to trend only upward (despite the fact that the detailed data presented in our August 26 Commentary presented facts suggesting otherwise). For good measure, I believe that the unemployment rate is really, truly 7.4%. For those of you who are not regular readers, this is a bit of sarcasm. Why?
Each month we get all kinds of data thrown at us around employment – weekly jobless claims, the First Friday Employment Report, the State figures from the BLS and the County data from the BLS. The media loves the First Friday Report because, despite its limited scope (survey of 60,000 to extrapolate what is going on nationally!), the media thrives on reporting it first and not worrying about the complete story. We have to be first – driven, of course, by our insatiable desire to know first (think elections – “we can project the winner after 1% of the votes are in”). Oh, for the days of fact checking before reporting breaking news. Sorry to get side-tracked.
Back to the employment data and why I’m still not feeling all that good about our economy. I call this the “Is Employment Really Growing Anywhere?” analysis. The good news is, yes. Let’s take a closer look. Below I consider factors to assess true growth in employment and utilize a third factor to weed out some false positives. I start with Job Growth over the year, chip away at true job growth by getting an understanding of the Employed as a Percent of the Population and round it out by looking at the number of Unemployed (which may be understated given people drop out of the Labor Force). I also use the recently released County level data which gets more granular than our First Friday, Jobless Claims and State level data (you know, the more time you have to collect and collate data, the chances are the quality improves). Now, the not so pretty picture.
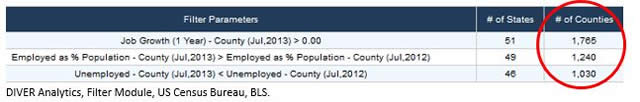
You say, “Gregg, over 1,000 counties saw real growth. What’s your problem?” Well, that’s less than one-third of all the counties in the US. Now, given you’re just back from a holiday weekend, I want to soften the blow and show you the “Job Growth” visual (in other words, I strip out the other factors and certainly do not take into account the types of jobs created – you know, part-time v. full time). Yellow, green and blue are positive.
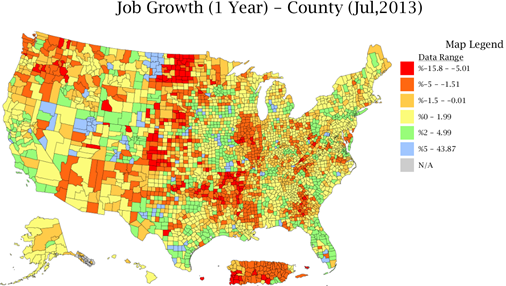
DIVER Analytics, Map Module, BLS.
Puerto Rico
One can’t help but notice Puerto Rico (not because it is oversized). On August 26, Barron’s cover story, “Puerto Rico in Trouble”, painted a grim picture of the island but did point out that “there are some big differences, however, between Puerto Rico and Detroit.” (Not terribly positive when the comparison is Detroit). Puerto Rico has taken “painful and politically unpopular steps to cut bloated government payroll, raise taxes and shore up its badly underfunded pension system.” The article cites a number of industry experts that note the importance of the coming year in Puerto Rico reducing its deficit and express guarded optimism. A quote worth repeating: “Puerto Rico is moving in the right direction, [Troy Willis, VP and Sr. Portfolio Manager at Oppenheimer Finds] says. It’s cutting the budget deficit and could have a structurally balanced budget in a year. That’s a lot more than you can say for the Federal Government.”
Before jumping into some data for you, I do note that Puerto Rico has still not reported their 2012 CAFR (they along with New Mexico) – a little thing called transparency goes along way. More on the subject of transparency in the coming weeks. As for our data exploration, I offer you a side by side of US averages, Puerto Rico and Illinois which is selected because it was cited as “[a]bout the only worrisome state situation … mostly due to its huge unfunded pension liability.”
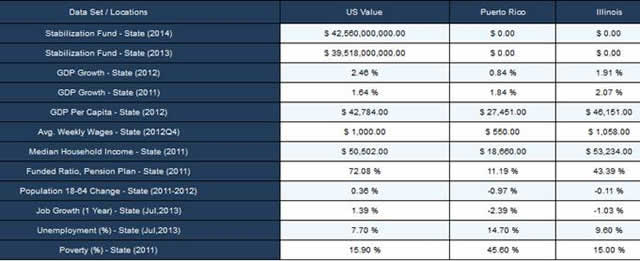
DIVER Analytics, Data Access Module, NASBO, BEA, US Census Bureau, BLS, Lumesis, State CAFRs.
One sure hopes that those unpopular decisions have the desired impact. We’re pulling for the self-governed US territory.
Affordable Care Act (I was told using “Obamacare” was politically incorrect despite the fact the President uses the very term. Really?).
I round out this week with a look at Exchange Act Implementation and Medicaid Expansion under the Affordable Care Act (aka Obamacare). Let me start by reminding you the colors on this first map do not represent political affiliation. In fact, quite the opposite. Blue = Federal Exchange; Yellow = Partnership Exchange; Red = State-based Exchange.
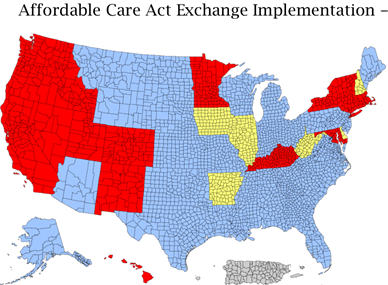
DIVER Analytics, Map Module, Center on Budget & Policy Priorities.
As for Medicaid expansion that is available under the Act, the visual below gives you the current status. Blue = Participating; Green = Leaning Towards Participating; Yellow = Leaning Towards Not Participating; Peach = Not Participating; Orange = Pursuing Alternative Model; Red = Not Eligible.
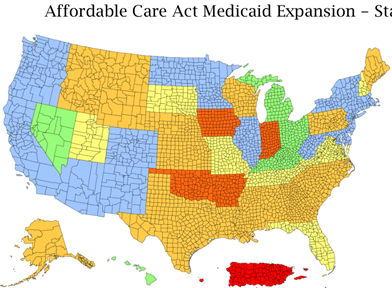
DIVER Analytics, Map Module, The Advisory Board Co.
Have a great week.
Gregg L. Bienstock
CEO & Co-Founder, Lumesis, Inc.
Data Released Last Week:
- Philly Fed Leading Index, July 2013, State
- Weekly Initial and Continued Jobless Claims, State, 8/17/2013
- Drought Intensity, County, Aug, 2013
- Job Growth, County, July 2013
- Unemployment, County, July 2013
- Employed as % Population, County, July 2013
- Labor Force, County, July 2013
- UPDATED: ARC as % of General Fund Revenue and Expenses, State, 2012
- UPDATED: Percent of ARC Paid, State, 2012
- UDPATED: Funded Ratio, Pension Plan, State, 2012
- UPDATED: Bankruptcy Filings - Issuers, State, County, 2013
- UPDATED: Default Filings - Issuers, State, County, 2013
© Lumesis


