As equity markets have pushed toward new highs this year, one of the worries lingering in the background has been the potential impact of China’s economic slowdown on the U.S. weakening demand from that country, the thinking has gone, could hurt the broad range of companies that export goods to China.
Perhaps such concerns have been overblown.
Weaker China, Stronger U.S. Stock Valuations
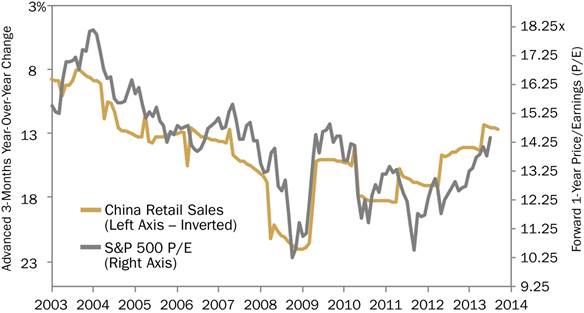
Source: Cornerstone Macro LP, 1/1/2003 to 7/31/2013
The axis measuring China’s Retail Sales has been inverted to more clearly illustrate the apparent correlation between weak sales growth and S&P 500 P/E ratios.
As this chart indicates, economic weakness in China—as measured by that nation’s retail sales (inverted above in gold)—has historically corresponded to higher valuations on U.S. stocks.
What’s driving this somewhat surprising relationship? Softening demand from China—particularly for fuel and food—helps to make the cost of these goods cheaper around the globe. U.S. companies are positioned to benefit strongly from these lower prices. In this country’s heavily consumer-driven economy, every dollar households don’t have to spend on necessities like fuel and food is a dollar that is likely to be pumped into other areas of the economy on more discretionary purchases. Companies across a number of sectors may enjoy better sales as a result—and the market can in turn reward them with higher price multiples.
Should it persist, this decoupling of equity markets in the U.S. and China could present investors with an intriguing set of opportunities among companies that benefit from U.S. discretionary spending. In our view, it bears further attention.
Past performance does not guarantee future results.
Economic predictions are based on estimates and are subject to change.
China Retail Sales Year-Over-Year (CNRSAMY) data is produced by the China National Bureau of Statistics (NBS). NBS published revised official retail sales figures for 1993 to 2005 on May 17, 2006. Only yearly revised data is provided. Price/Earnings Ratio (P/E) of a stock is calculated by dividing the current price of the stock by its trailing or its forward 12 months’ earnings per share. S&P 500 Index is an index of 500 U.S. stocks chosen for market size, liquidity and industry group representation and is a widely used U.S. equity benchmark. All indices are unmanaged. It is not possible to invest directly in an index.
CFA is a trademark owned by CFA Institute.
© Heartland Advisors


