In early 2012, you ventured the opinion that the commercial real estate market was in recovery mode and in the initial stage of a seven- to ten-year cycle of expansion and profitability. What is your view now that another year has passed?
Joel Beam: We are that much further along. On the whole, the fundamental leasing, occupancy and absorption trends we’re seeing augur well for the industry, and I can comfortably say the recovery is continuing to unfold.
Remember,commercial property isn’t as mercurial as sectors like technology. It’s more like an aircraft carrier. Once it’s on a course, it doesn’t turn quickly.
Ian Goltra: As we’ve pointed out before,the real estate cycle is all about supply and demand. In prior recessions, commercial real estate got into trouble because there was too much supply. In the 1980s, we had a massive surplus of development because investors were looking for tax-advantaged ways to use their capital—not because projected demand warranted it. When the Tax Reform Act of 1986 took the bloom off limited partnerships, development slowed to a fraction of what it had been. But of course, it was already too late, and we had a huge oversupply in many markets. So in the early ‘90s, the Resolution Trust Corporation had to be organized to work through all of the misdeeds of the ‘80s.
Looking at where we are today, relative to how we came out of prior recessions, which are shown in the exhibit as shaded areas, you can see we’re starting this cycle with much lower levels of new construction, in terms of both absolute square footage and as a percentage of existing inventory (Figure 1).
What the exhibit doesn’t reflect is that these markets have grown massively in the last 40 years, greatly expanding the potential demand for new space. For some property types, new construction as a share of existing stock is at an all-time low. So as demand recovers, we would expect to see asking rents rise.

What are your thoughts on the demand side of the equation? Last year you emphasized that the recovery scenario was predicated largely on continued improvement in the economy.
Things seem to be getting better, but are they better enough?
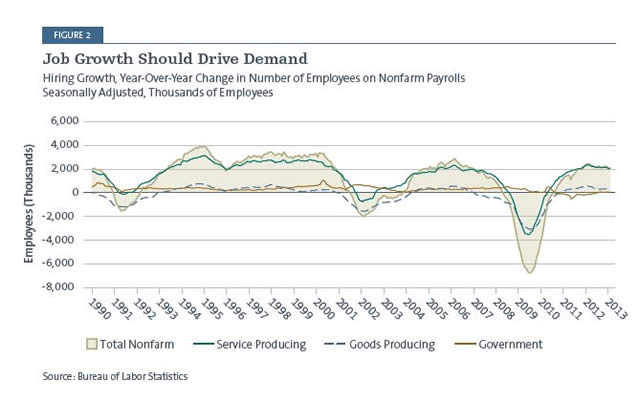
Joel Beam: It’snot a complicated story. Growth in commercial real estate is driven by growth in jobs and population, pure and simple. Gross domestic product is a great trailing indicator, but people in the industry base their outlook on monthly job numbers, and compared to where things were in 2009, we’ve had quite a recovery (Figure 2).
As the economy continues to recover and employment grows, tenants are increasingly willing to take risks—whether that means a young couple moving to a bigger apartment, a retailer deciding to open a new store or a company leasing more space based on its hiring plans. That’s being reflected in positive net
absorption rates—meaning leased minus vacated space—across the office, retail and apartment sectors. Because some inventory has been added to the market in the apartment sector, its absorption level has dropped somewhat from the spike back in 2010, but in our view the picture is still an encouraging one for all the core sectors.
In recent months we’ve also seen housing prices improve in some markets across the country, including some that were pretty hard-hit. Is that recovery on a different track from the one you’re describing in commercial real estate?
Ian Goltra: Residential real estate is a completely separate discussion; those market dynamics are very different from the ones impacting commercial properties. While housing markets in many major metropolitan areas have become healthier, many smaller markets are still working their way out of a credit-fueled bubble. Complicating that process is the tide of speculative investors who are seeking quick profits by flipping homes, which in many markets is clouding the chances of any real recovery.
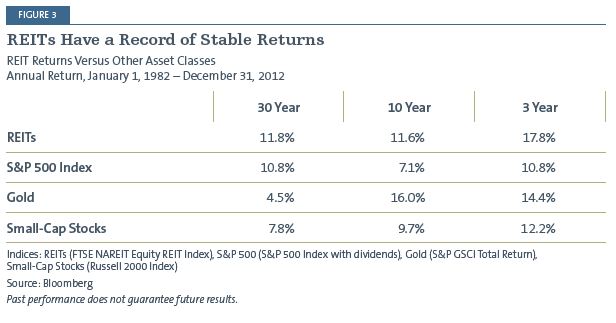
Commercial real estate is not as highly leveraged and pre-recession prices weren’t bid up as dramatically as they were in hot housing markets. So for investors who are looking at real estate, it’s important not to let their experiences with the housing market color perceptions of commercial property investments like REITs. Commercial real estate is a $7 trillion market with long-duration returns and a track record that compares favorably to that for stocks and other asset classes (Figure 3).
Getting back to more recent trends—what do they mean for lease pricing and the profitability of real estate operations going forward?
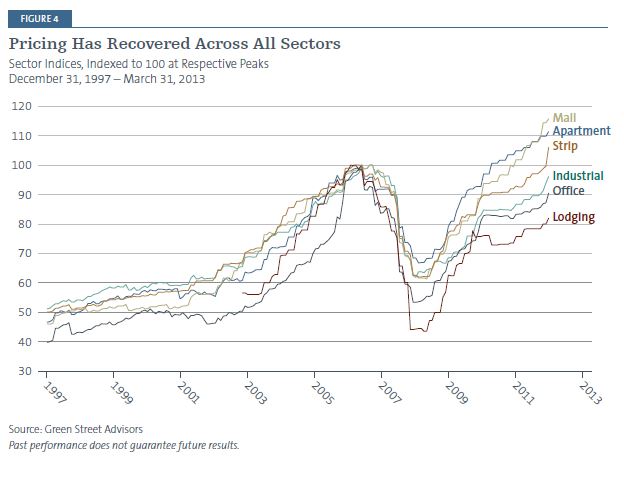
Joel Beam: Since the financial crisis—a big initial joltto the industry—we’veseen a pronounced recovery in pricing for all real estate sectors (Figure 4). Certainly some, most notably apartments and regional shopping malls, have recovered to a greater degree than others. At the other end of the spectrum, hotels have recovered substantially, but still have a way to go to get back to their peak valuations; that’s true in some other sectors as well.
Ian Goltra: In terms of profitability, industry analysts are forecasting a 3% average annual growth in net operating income (NOI) through
2017.
Just to be clear, NOI means nothing more than rental income minus expenses at the property level; it ignores debt service and any general or administrative costs incurred by the company that owns the property.
![]() A 3% annual growth rate may not sound like a lot. But any experienced commercial property investor would tell you that a 3% average annual growth rate in NOI is quite attractive, especially when you’re talking about REITs with high-quality properties and tenant exposure. Beyond that, forecasts that add an appropriate amount of leverage to the equation point to significantly greater expectations for growth in cash flow at the company level, and nearly 8% growth for the REIT sector into 2014.3
A 3% annual growth rate may not sound like a lot. But any experienced commercial property investor would tell you that a 3% average annual growth rate in NOI is quite attractive, especially when you’re talking about REITs with high-quality properties and tenant exposure. Beyond that, forecasts that add an appropriate amount of leverage to the equation point to significantly greater expectations for growth in cash flow at the company level, and nearly 8% growth for the REIT sector into 2014.3
Joel Beam: We should point out that this expectation for NOI and cash flow growth is shared among all the major property sectors. That said, there is some standard deviation by sector—which is one of the reasons why a diversified approach to commercial property investing makes good sense.
What about geography? There’s that old adage that the three keys to real estate are location, location and location. Last year you had a map showing your expectations for a recoveryplaying out in uneven waves across U.S. markets. Does that map look different today?
Ian Goltra: Yes,we love maps! Last year’s map was simpler, because it focused on the gateway cities where we thought job growth and property investments would be concentrated—Boston, New York and Washington, D.C. on the East Coast; Seattle, San Francisco and Los Angeles on the other side of the country. That is indeed how things have played out so far, although I have to say that the L.A market hasn’t seen the same level of recovery as Seattle and San Francisco.
Neither the D.C. nor New York market suffered as badly during the recession as the rest of the country. D.C., of course, benefits greatly from having the federal government as its regional employment anchor. However, we are beginning to see some softening in demand for office space due to the sequester, which is slowing down hiring by federal agencies as well as the vendors and contractors who work with the government. D.C. has also seen quite a bit more construction
of multifamily housing than other markets, so it’s the exception to the trend toward lower vacancy rates and higher rents for apartments. We’ll be keeping a close eye on that market, to be sure.
As for New York, that market certainly did see some softening in demand stemming from layoffs in financial services during the recession. Unfortunately, those companies are generally still not growing in the New York area, and some may even experience more layoffs. But from a commercial property standpoint,the good news is that the New York metro economy is diverse, and a lot of new activity in technology, advertising, media and information systems companies is taking up the slack.
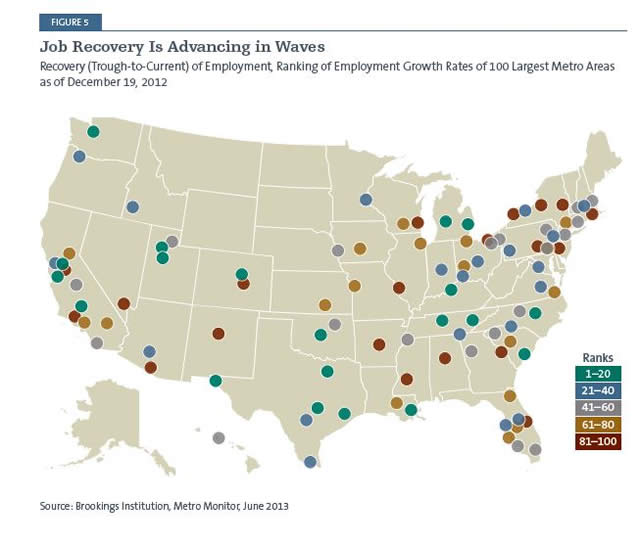
Joel Beam: As our updated map shows, the recovery in job growth is now moving from the coastal gateway cities to other employment centers across the country, like Denver, Austin, Louisville, Raleigh-Durham and Tulsa (Figure 5).
The reality, though, is that the country is peppered with second- and third-tier markets where demand for commercial space is soft and not much job growth is occurring. In places like Tucson, Oklahoma City and markets in the upper northeast far from New York City, full recovery could take quite a long time.
As far as property investing goes, the job growth that has occurred so far has been enough to fuel ongoing bottom-line earnings growth in the REITs we cover. But I don’t want to minimize how tough things are for people in those markets where growth is sluggish at best.
REITs have already come up a couple of times in this conversation. You’ve always said that you’re big believers in public REITs as the way for individual investors to access commercial real estate. How are REITs, in particular, faringin this market?
Ian Goltra: If anything,our views on the advantages of REITs are stronger than ever. They enable small investors to have a stake in major properties, like high-rise, office buildings or regional shopping malls that only the biggest investors can buy into directly. And as we see it, no other form of real estate exposure can match the liquidity and transparency that REIT stocks offer. We also like REITs’ historically low correlations to the stock market,4 and the fact that they are required to distribute 90% of their taxable income to shareholders if they want to avoid paying corporate taxes.
Joel Beam: One of the advantages REITs have in this environment is good access to capital. Real estate is a leveraged asset class, and lending is hugely important to transactions and investing
in this space.
Have the industry’s lending sources or ability to secure financing changed significantly since 2008?
Joel Beam: For a long time commercial mortgage-backed securities (CMBS) had the lion’s share of real estate lending. And we know all too well what happened to the securitized loan market in the jaws of the financial crisis—from about $270 billion in issuance at the peak, back in 2007,it fell off to almost nothing. It has come back somewhat since, with a total of about $64 billion in issuance in 2011 and 2012, but at about $587 billion in all, the aggregate value of outstanding CMBS is still 29% below its peak.5
Ian Goltra: During the crisis all the spigots were turned off. But interestingly, the big bulge-bracket banks like Citigroup or BofA Merrill Lynch weren’t among the first ones to come back in. Life insurance companies looking for yield and actuarial returns were effectively the first to become active.
Joel Beam: This meant that in the period following the financial crisis, well underwritten properties could still get financing, but it was from an insurance company at a 50% loan-to- value ratio on a very conservative valuation—not a conduit loan offered with favorable terms based on pending securitization of the obligation, as commercial property lending had generally been structured prior to the meltdown.
Since all real estate sectors took a price hit in the crisis, the life insurance companies pretty quickly realized that it made sense to be a lender if they could be in for a smaller share of the loan based on a lower valuation number. They got active and that helped the CMBS market’s comeback.
The reality for REITs, however, was that capital was initially very expensive amid all this upheaval. In April 2009, Simon Property Group, the biggest REIT in the country, borrowed more than a billion dollars by issuing bonds with a yield greater than 10%. That’s a hyper-expensive rate to pay for capital; that company today could issue ten-year bonds for 3%. But what this did was to open the gates for other companies to get involved, which they subsequently did at progressively decreasing rates.
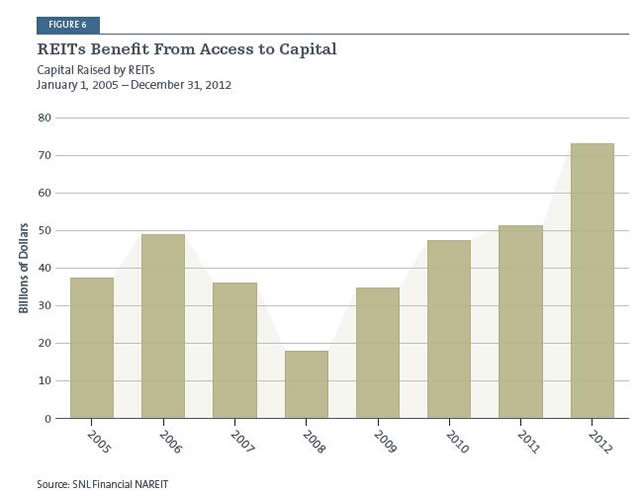
Fast-forward to 2012,and the figures show that strong investor interest in REITs brought $73.3 billion in capital to the sector during the year—a much higher number than in 2006 when a lot of capital was flowing into the markets (Figure 6). That’s very encouraging.
One subject we haven’t dealt with yet is the current valuations for REIT stocks. Given all the advantages you’ve listed, haven’t they been bid up to high price levels?
Joel Beam: I think our team operates with a healthy skepticism about pricing in the market, and while I wouldn’t say REIT stocks are cheap, in my opinion they are fairly valued given the market climate we’ve been discussing. As we’ve already mentioned, REITs also have some inherent advantages that I believe have tangible value, not the least of them being liquidity. And let’s not forget that REITs are also a source of dividend income.
I personally appreciate the fact that when you’re investing in property through liquid REIT securities, it’s not difficult to move around among market sectors based on judgments about where things are going. And, because you’re dealing in public markets, there are also opportunities to profit from pricing anomalies and misperceptions, not to mention mergers
and acquisitions.
You seem firmly committed to REITs as an investment vehicle.
Joel Beam: Bottom line,we believe in REITs because they let individuals access the returns from institutional-quality property assets. Retirement plan sponsors and other major investors are buying shopping malls and office buildings because they are looking for long- duration, actuarially-driven returns that don’t correlate with equity markets or, for that matter, with bonds. The REIT structure was created so the rest of us could have access to the same kinds of return streams as the biggest investors.
Let’send on a practical note: How do real estate and REITs fit into investors’ portfolios? In your view, what’s the right way to think about them?
Ian Goltra: At the start of this conversation we likened real estate to an aircraft carrier that is slow to shift course. To me, that’s one of the most appealing things about this sector. These companies are the stewards of hard assets that represent a store of value—by which I mean we’re not going to wake up tomorrow and find that some new technology has rendered an office building on Park Avenue obsolete.
This is an asset class that has delivered an average return of 11% for the last 30 years.6 I’ve always felt that if you’re thinking about long-term wealth accumulation, it’s good to make some investments with a view toward decades and not just quarters.
You should consider the investment objectives, risks, charges and expenses of the Forward Funds carefully before investing. A prospectus with this and other information may be obtained by calling (800) 999-6809 or by downloading one from www.forwardinvesting.com. It should be read carefully before investing.
RISKS
There are risks involved with investing, including loss of principal. Past performance does not guarantee future results, share prices will fluctuate and you may have a gain or loss when you redeem shares.
Concentration in a particular industry will involve a greater degree of risk than a more diversified portfolio. Investing in the real estate industry or in real estate-related securities involves the risks associated with direct ownership of real estate which include, among other things, changes in economic conditions (e.g., interest rates), the macro real estate development market, government intervention (e.g., property taxes) or environmental disasters. These risks may also affect the value of equities that service the real estate sector.
Diversification does not assure profit or protect against risk.
There is no guarantee the companies in our portfolio will continue to pay dividends..
Definition of Terms
Correlation is a statistical measure of how two securities move in relation to each other.
FTSE NAREIT Equity REITs Index is representative of the tax-qualified REITs listed on the New York Stock Exchange, the American Stock Exchange and the NASDAQ National Market.
A loan-to-value ratio is a lending risk assessment ratio that financial institutions and others lenders examine before approving a mortgage.
Russell2000 Index measures the performance of the
2,000 smallest companies in the Russell 3000 Index. The Russell 3000 Index represents approximately 98% of the investable U.S. equity market.
S&P 500 Index is an unmanaged index of 500 common stocks chosen to reflect the industries in the U.S. economy.
S&P GSCI Gold Index is a sub-index of the S&P GSCI, which serves as a benchmark for investment in the commodity markets and as a measure of commodity performance over time. The index tracks gold futures on the COMEX, the primary market for trading metals such as gold, silver, copper and aluminum.
Standard deviation is applied to the annual rate of return of an investment to measure the investment’s volatility.
The Tax Reform Act of 1986 was a law passed by the U.S. Congress that simplified the income tax code by simultaneously lowering the top tax rate and increasing the bottom rate.
Transparency is the extent to which investors have ready access to any required financial information about a company such as price levels, market depth and audited financial reports.
Valuation is the process of determining the value of an asset or company based on earnings and the market value of assets.
One cannot invest directly in an index.
1. Bloomberg, 01/01/82 – 12/31/12
2. Green Street Advisors Inc., as of 05/22/13
3. Citi Research, the Hunter Express & Lodging Valuation Tool, 06/10/13
4. Wells Fargo Securities and Intex Solutions, as of 12/31/12
5. Simon Property Group (SPG) is a holding of Forward Real Estate Long/Short Fund and Forward Real Estate Fund, as of 06/19/13. Holdings are subject to change.
6. Bloomberg, as 01/01/82 – 12/31/12
Forward Funds are distributed by Forward Securities, LLC. Not FDIC Insured | No Bank Guarantee | May Lose Value
© 2013 Forward Management, LLC. All rights reserved.
FSD000201
081514
© Forward Management