Chicago Post Script, Reported Data Errors (Really) and What is a “Geo Score”?
Chicago and Detroit – A Guest Commentary Post Script of Sorts
Following the release of last week’s guest commentary by Josh Laurito, the BLS released State-level employment data. The following was posted on our blog and is reprinted here:
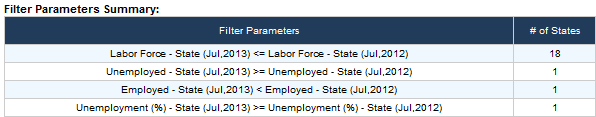
Earlier today, Lumesis posted our weekly commentary that compared Chicago to Detroit. This morning, new data was released by the BLS around State-level employment. I encourage you to look carefully at this newly released data. We did so using the DIVER Analytics Filter Module (another idea is to look at the data individually using the Map Module). A hint as to the outcome: while Illinois is not Chicago, it certainly may be a proxy.
Reported Data Not Always What it Says – Wrong in Some Cases
Regular readers know I periodically suggest looking at alternative data points to gain a broader perspective. In this instance, something a little different. At the core of the DIVER platform is our database and we take data integrity very seriously. So much so that we periodically find errors in reported data. Many times, the source will correct the data as we notify them. Typically, when we find an error in a CAFR, the source will defer the correction until the next CAFR is released. In DIVER however, we will display the accurate values. Two examples of recent data issues we bring to your attention:
- 2012 Philadelphia, PA CAFR reported Primary Gov’t Debt as 0.1% of Personal Income. The correct number is 12%. Per our discussion with the city, this will be corrected in their filing next year.
- -012 Omaha, NE CAFR, top employers. The third highest on the list had fewer employees than the second, but the same % of total city employment. The value was displayed as 1.93% v. the actual value of 1.29%. We do not believe Omaha will make a correction until next year.
A Temporary Reprieve Before the Battle : While Congress is on its six week (yes six week) holiday, some of our Congressional representatives are using their time to get some things done. Reports surfaced late last week that a temporary spending bill will be presented and will likely pass in the Senate shortly after Congress’ return in early September. This will allow us to avoid the drama of a possible government shutdown for at least another 60 days or so – that is, until they have to address the debt ceiling. By all accounts, that is when the gloves will come off – Affordable Care Act, Tax Reform, you name it. Remember, even with the short-term spending bill, the Sequester order for 2014 has already been signed and, absent Congressional action to reverse spending “cuts” the order is in tact – check for those extraordinary call provisions in your BABs.
Housing Prices – Half Full or Empty?
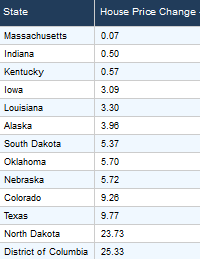
A few weeks back, we took a look at Residential Mortgage Delinquency Rates and Homeowner Vacancy Rates (See August 12, 2013 Commentary). At the time, we expressed some trepidation with the pundits who continued crowing that the housing market is humming along and we are back to where we were before the financial crisis. While improving, not quite there yet as evidenced by the recent FHFA data. Last week saw the release of the FHFA’s Seasonally Adjusted, Purchase Only Housing Price Index. The year on year average increase for housing prices was about 6.6% with a median increase of 4.66%. However, if you go back to the second quarter of 2008 and compare housing prices to the recently released second quarter 2013, the average is (3.74%) and the median is (4.23%). Context for you: 12 States and DC have seen Housing Price Changes on the plus side over this five year period.
As we all know, housing prices drive assessed values which are the primary driver of property taxes (that is along with the mill rate – after all, how many of us can say our property taxes are down since the second quarter of 2008). Remember, assessed values generally lag housing prices by about 2 years.
What is a Geo Score & Let’s See It in Action
A few weeks back, Lumesis introduced its Geo Score, a relative score of the economic and demographic health of the scored location. Since its release, we have fielded many questions about the score, its availability, frequency of updates and the like. Below we answer many of those questions as well as provide some examples of our score in action.
What is the DIVER Geo Score?
The Geo Score was developed by Lumesis to assist our users in better understanding the overall economic health of a particular geographic area. We believe this to be important in the analysis of municipal credit as the health of an economy will translate into tax receipts and government expenditures.
The Geo Score is expressed on a simple 0 to 10 scale with 10 being the best.
What Geographies Does the Score Cover?
The Geo Score is available for all States, counties and approximately 330 of the largest cities.
What is the Geo Score Based on and How is it Calculated?
The Geo Score is a relative scale where States are compared to each other, counties are compared to each other and those cities we score compared to each other. For each geographic scoring category, Lumesis evenly distributes locations across the 0 to 10 scale.
The Geo Score is a calculation that brings together multiple, meaningful economic and demographic factors related to three primary data categories: Employment, Income and Housing. The data is normalized, weighted and combined to derive the Geo Score.
How Often is the Geo Score Updated?
The Geo Sore is updated the last business day of each month.
Does the Geo Score Provide a Score for a Bond or Issuer?
No. The Geo Score provides a score of the overall economic health of a particular geographic area – State, County or City. We believe this to be important in the analysis of municipal credit as the health of an economy will translate into tax receipts and government expenditures.
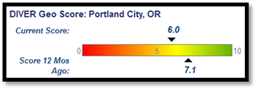
DIVER Geo Score in Action
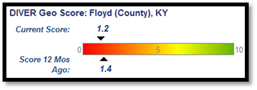
A couple of weeks back, one of the rating agencies downgraded and then withdrew its rating for Floyd County, Kentucky. Initially, they took the county from A2 to Ba1 and then withdrew their rating. What did the Geo Score show?
A few others to consider:
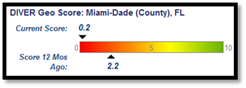
Miami-Dade – Taken off watch. Really?
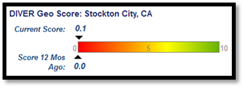
Stockton, CA – We know what happened.
Point being, can the Geo Score help you in instances where there is no rating or the rating has not been revisited for a period of time? Can it help you identify, directionally, where the economy is heading for a given locale? While the Geo Score is not a rating nor a score for an issuer or given bond, it provides you a monthly view into a score that focuses on key factors driving revenue and spending.
Where Can I Find the Geo Score?
The Geo Score can be found in the DIVER Analytics and Advisor platforms. In coming weeks, select Geo Scores will be available for free on our website, www.lumesis.com. For more information on how to access the Geo Scores please contact us at [email protected] or 203.276.6500. If there is a publication or place you would like to see it, let them and us know and we will work to make it available through other sources.
Gregg L. Bienstock
CEO & Co-Founder, Lumesis, Inc.
On the Road: Another busy week as we head towards the unofficial last weekend of the Summer. The team will be in NYC and Philadelphia this week.
Data Released Last Week:
- NEW: Affordable Care Act Medicaid Expansion, State, July 2013
- Median Household Income Change, State
- Housing Price Index, County & State, 2013 Q2
- House Price Change, 2012 Q2 - 2013 Q2, State
- Weekly Initial and Continued Jobless Claims, State, 8/10/2013
- Coincident Index Change, July 2013, State
- UPDATED: Default Filings - Issuers, State, County, 2013
- UPDATED: Bankruptcy Filings - Issuers, State, County, 2013
- Labor Force, State, July 2013
- Job Growth, July 2013, State
- Employed as % Population, State, July 2013
- Unemployment and Unempl. Rank Change, July 2013, State
Expected Releases This Week:
- DIVER Geo Score - Current
- Bankruptcy Filings - Issuers
- Default Filings - Issuers
- Employed - County, City
- Job Growth (1 Year) - County, City
- Labor Force- County, City
- Unempl. Rank Change- County, City
- Unemployed- County, City
- Unemployment (%)- County, City
- Employed as % Population- County, City
- Philly Fed Leading Index – State
- SPECIAL EVENT: Tornadoes – County
- Cont. Jobless Claims – State
- Weekly Initial Jobless Claims – State
- Fed. Funds Received – Total – State, County
- Federal Funds Change (3 year) – County
- Defense Expenditures as % GDP – State
© Lumesis


