Revisiting the USD Bull Market
We are no longer waiting for the USD bull market – it is here. In this follow-up to his December 2012 Blue Paper, The U.S. Dollar: Awaiting the Upcoming Bull Market, Paresh Upadhyaya examines developing trends in global currencies, as well as key fundamental factors in support of a USD rally.
Key Points
- Over the last few decades, the U.S. dollar (USD) has oscillated between a cyclical or pro-growth currency and a countercyclical (safe-haven). There are emerging signs the USD is transitioning to a pro-growth currency.
- Several factors have moved in favor of the USD, including divergences in global interest rate expectations and expectations for rising rates in the U.S.
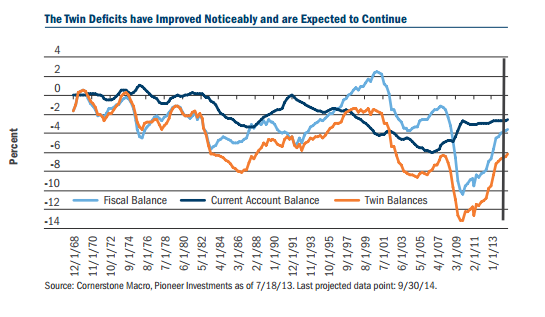
- In addition, significant slowing in USD diversification and developments in the “twin deficits” (current account and fiscal balance) have emerged. Formerly cited as neutral, these factors have improved noticeably and are expected to continue.
- We believe the factors outlined in this paper provide a strong fundamental underpinning for a USD rally going forward.
USD Transitioning to a Pro-Growth Currency
Over the last few decades, the USD has oscillated between a cyclical, pro-growth currency and a countercyclical “safe-haven.” In the 1990s, the USD was a cyclical currency, while in the 2000s it has been countercyclical. However, there are emerging signs the USD is transitioning to a pro-growth currency.
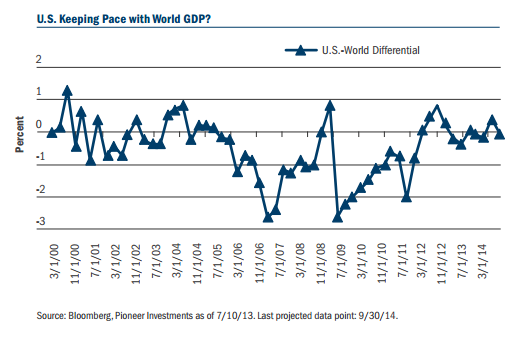
- The U.S. economy is currently “outperforming” global growth. Since 2000, World GDP has averaged 2.4% while U.S. growth averaged 1.8%, producing a differential of 0.6%. Since 2012, global growth has been growing at 1.8%, underperforming its average by 0.6%, while U.S. growth expanded to 2.1%, outperforming its average by 0.3%. This has resulted in U.S. growth outperformance of nearly 1%. Looking ahead, consensus forecasts the U.S.-to-World growth differential at near zero over the next 6 quarters – continuing to support U.S. growth outperformance.
- The U.S. is emerging from a very painful household balance sheet adjustment.
- Healthy U.S. corporate balance sheets and relatively strong domestic fundamentals are leading to strong portfolio inflows into U.S. equities, similar to the late 1990s.
- A manufacturing renaissance and less dependence on foreign oil are contributing to a manageable current account deficit.
Factors Have Moved in Favor of the USD
1. Divergence in G4 Monetary Policy
There are divergences in global interest rate expectations. On June 19, the Federal Open Market Committee (FOMC) held a monumental meeting that essentially ended the Fed‘s easing cycle and laid the groundwork that would trigger its tightening cycle. The U.S. has started what is likely to be a lengthy process of exiting Quantitative Easing (QE). At the FOMC meeting, the Fed communicated its bias to first taper and then formally exit QE. On the tapering guidance, the Fed stated that if the incoming data are broadly consistent with their economic forecast, this would moderate the monthly pace of purchases later this year, where most analysts expect it to begin in September.
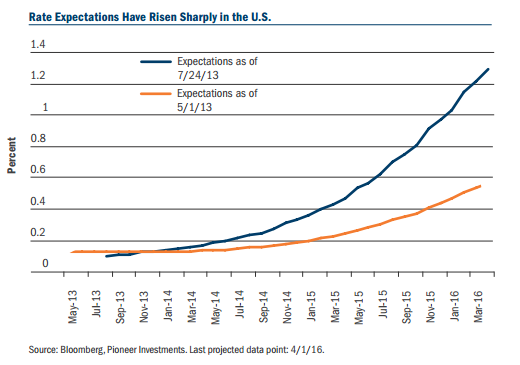
On exiting QE, the Fed commented, “If the subsequent data remain broadly aligned with the current expectations for the economy, “they would,” continue to reduce the pace of purchases in measured steps through the first half of next year, ending purchases around midyear.” As a result, expectations have risen sharply. The Fed is expected to begin to taper in September and hike the Fed funds rate as early as Q2 2014, following the June 19 meeting – compared to expectations of just two months earlier, when financial markets were expecting the tightening cycle to begin in Q1 2015 (See Chart below).
On the other hand, the rest of the G4 nations are expected to maintain very accommodative monetary policy or, more likely, implement further easing (conventional and/or unconventional).
The European Central Bank (ECB)
In an historic break with protocol, the ECB announced its forward guidance by stating that its interest rate will stay low for an extended time. This unprecedented step reflects an economy that remains mired in a deep and protracted recession, with the growing risk that inflation could undershoot its 2% target. It also reflects continued unease at the tightening in monetary/financial conditions triggered by the recent sharp rise in 10-year yields.
Of the factors mentioned, the ECB will probably be most concerned about the growing risks of inflation undershooting its 2% target. The market is projecting inflation to remain below the ECB target well into 2015. This increases the pressure on the ECB to implement easier monetary policy.
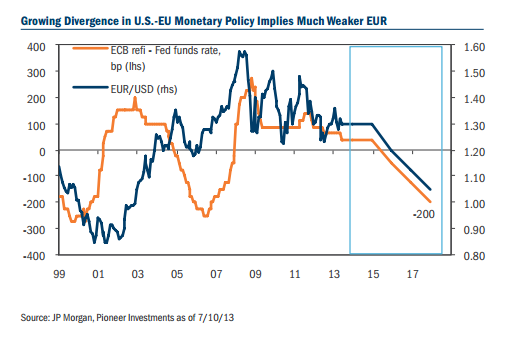
With expectations that the Fed will commence rate normalization earlier and deliver much more than the ECB, the flip in the ECB-Fed rate differential (from the current 50 basis points (bp) in Europe’s favor to 200bp in the U.S.’s favor by 2017), is quite euronegative over the long term. Historically, a shift in rate spreads that large would be worth at least a 20-cent decline in the currency over four years.
The Bank of Japan (BoJ)
On April 4th, the BoJ delivered very aggressive monetary easing – what I call the 2-2-2-2 plan. The BoJ is looking to double the monetary base, double the purchases of Japanese government bonds and target 2% inflation within 2 years. Given the size of the output gap and the aggressive inflation target, the BoJ will be easing for at least a few years.
The Bank of England (BoE)
Similar to the ECB, the BoE is set to introduce its own forward guidance following the release of its Quarterly Inflation Report in August 2013. While we do not know the details, economists speculate that the BoE could signal a commitment to keep interest rates low for a long time, target nominal GDP, or follow the Fed with an unemployment target and an inflation knockout. Therefore, another foray into QE will adversely weigh on the British Pound.
2. Major Slowing in USD Diversification
The aforementioned Blue Paper, The U.S. Dollar: Awaiting the Upcoming Bull Market, went into great detail about the potential structural change in global FX reserve growth going forward, mainly with respect to China. There has been a significant slowing in global Foreign Curency (FX) reserve growth, which we believe will have an immediate impact, slowing the demand for USD diversification.
Significant Developments in China
As China is home to the world’s largest FX reserves, we would like to highlight some important long-term developments there. We believe the long-term trend of structural appreciation for the Renminbi (RMB) may have come to an end, for a few reasons.
- The Chinese economy is attempting to undergo a significant transformation from investment/export-led growth to consumption-led growth. This will likely lead to a slower growth trajectory.
- The currency no longer appears to be grossly out of sync with fundamentals. Since the end of its “defacto” peg in July 2005, the RMB has appreciated approximately 26% against the USD and 32% on a REER TWI basis – referring to the real and tradeweighted effective exchange rates calculated from Bloomberg. The level of the exchange rate is beginning to slow export growth and has reduced the once sizeable current account surplus.
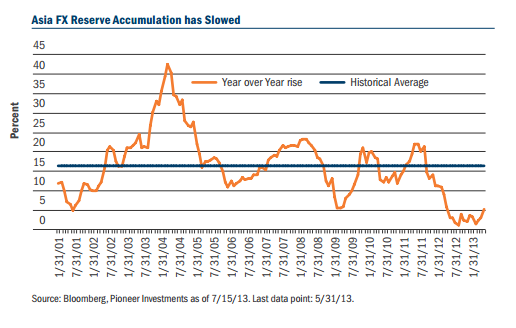
- China is signing bilateral trade agreements that will reduce the amount of USDs in trade transactions. All these factors have started to reduce inflows into China. This is most evident in FX reserve accumulation that grew just 8.0% year over year (yoy) in June 2013 – well below its 12-year average of 28.8%. If this trend continues, there will be far lower USD inflows and therefore less need for the Peoples Bank of China (PBoC) to diversify away from USDs into other currencies.
China is not alone in witnessing a slowdown in FX reserve growth – this is a global phenomenon. We estimate that Asian FX reserves grew by just 4.8% yoy in June 2013, well below the long-term average of 16.4%. In fact, FX reserves in Japan, Thailand, India, Indonesia and Australia are contracting on a yoy basis. The other region that has historically experienced strong FX reserve accumulation has been the Middle East. Similar to Asia, reserve accumulation grew 15.4% yoy in March 2013, in contrast to the long-run average of 24.6%. Less U.S. stimulus and weak global demand will constrain Asian FX reserve accumulation while the factors mentioned above and stable oil prices will affect Middle East reserve accumulation.
If there is less FX reserve accumulation, then there will be reduced demand to diversify USDs into other currencies, such as the EUR, AUD, CAD, etc. While this has been a structural headwind for the USD, we do not think it will be a hindrance going forward.
3. The Twin Balances have Turned
Historically, the twin balances (current account and fiscal balance) have been a major headwind for the USD. At the time of my original Blue Paper this factor was neutral – an upgrade from the normally negative factor. However, recent developments on both counts have been much more positive than previously anticipated and therefore, from a relative perspective, this factor has become positive for the USD.
There are tentative signs of a positive structural change in the current account deficit that, if maintained, should have positive long-term ramifications for the USD. The current account deficit has been on a narrowing trend since hitting an all-time high of 6.1% of GDP in Q3 2006, to stand at 2.7% of GDP as of Q1 2013 – the lowest deficit since 1999. The service and income surplus has been on an upward trend since 1980. The trade deficit has been the largest contributor to the current account deficit and has narrowed a bit during the last year. Lower energy imports is an important factor behind the declining current account deficit.
The biggest improvement in the twin deficits comes from the fiscal deficit. A combination of strong tax receipts and a reduction in expenditures has substantially lowered the fiscal deficit from 10.4% in 2009 to a projected 3.6% by Q3 2014. The Congressional Budget Office estimates the fiscal deficit will stabilize around 2.5% until 2019.
Conclusion
The USD bull market has begun with signs that the USD is transitioning to a cyclical currency. Monetary policy divergences in G4, slowing in USD diversification and a dramatic turnaround in the twin deficits, provide a strong fundamental underpinning to a USD rally going forward.
© Pioneer Investments