This week’s Tidbits are a bit longer – text wise – than usual. I focus on the end of QE (or the beginning of tapering) and then take a quick look at counties in Michigan feeling the impact of Detroit’s filing. I then move on to a review of a very uneven housing market and offer a quick observation on exports before concluding with some State Geo Scores to consider.
Fisher Said What? Did Ben Know? You Bet
About a month ago, Chairman Bernanke broached the subject of the Fed ending its bond buying program (aka QE) sometime this fall only to have the message softened after the markets reacted violently to his statements. Last week, Dallas Fed President, Richard Fisher, made clear his view that “there is a need to dial back monetary accommodation in the system” and told CNBC that the Fed may begin to dial back its bond purchase program as soon as September. The market’s reaction – ho-hum. Both Fisher’s view and the market’s reaction were somewhat surprising. While there are signs of marginal improvement in parts of the economy, we are nowhere near 6.5% unemployment and not all signs are positive (we touch on this below). Also, one can surmise that Fisher was not making these statements without someone knowing (evidenced by no refutation from anyone else), yet no one seemed to take notice.
Some thoughts around the possible impact on -Munis. First off, we saw how the municipal bond market responded when Chair Bernanke suggested tapering. Let’s fast forward to when tapering starts – rates rise (and, as some speculate, the beginning of the long upward climb). The economy, while arguably in a slow recovery, is nowhere near where it was and, with rates rising, one can foresee a slowdown in the housing market and other areas of the economy. With many municipalities relying on debt, they will see their cost of issuing debt go up and be left with some potentially stark choices – slow spending, limit issuance or raise taxes. This will be especially prevalent in those places where the recovery is not what it is cracked up to be (see below). Undoubtedly, as this new cycle begins, assessing credit quality and understanding how economic data will impact an individual municipality as well as the larger economy becomes increasingly important.
Woe Be the Michigan County that Wants to Issue Debt
At least three Michigan municipalities have pulled back on planned debt offerings in the wake of Detroit’s bankruptcy filing. Some suggest that investors are penalizing these places with a premium given the, now open question around, what does a “general obligation” mean? Perhaps it is more than this uncertainty, perhaps not. A quick look at two of these locations plus Detroit. Just maybe the market is saying something else.
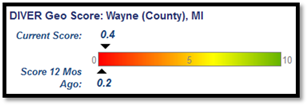

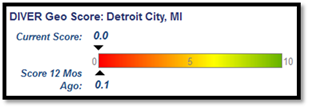
Lumesis Geo Score, Patent Pending.
Housing – A 2nd Visit
This week saw some interesting headlines around housing that told us that delinquencies are the lowest they have been in years and that housing prices, according to the National Association of Realtors, are up significantly. Fuel to the fire that the housing market is humming along. Or is it?
Many of you know one of my familiar mantras is “look beyond the headlines.” Let’s start with revisiting a data point we observed last week:
“22 States have seen growth in their Homeownership Rate over the past year. Here’s my dilemma, on the one hand, I am not thrilled that only 22 States have seen growth especially with interest rates so low. On the other hand, you can’t help but wonder if this is part of the new normal – more Americans recognizing they simply can’t afford to own their own home and behaving responsibly. In the long run, that may not be a bad thing.”
Now some data to consider beyond the delinquency headline. The average Residential Mortgage Delinquency Rate for June is about 6.5% (compared to a year ago at 6.86%). However, 15 States have not experienced a decline in delinquency rates year over year (see below) and Mississippi tops the delinquency charts at just over 13%.
![]()
DIVER Analytics, Filter Module, LPS.
Let’s also consider Homeowner Vacancy Rates – a full 18 States have a higher Homeowner Vacancy Rate than they did one year ago. Here is a look at the highest rates amongst those that have seen this metric move in the wrong direction.
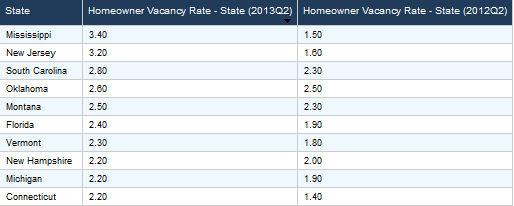
DIVER Analytics, Filter Module, US Census Bureau.
To round out the Housing picture, I next consider the FHFA Housing Price Index at the State level. While some point out that housing prices are rising based on their sampling (Case Shiller looks at a set of large cities and the National Association of Realtors has their approach), the FHFA has some decent data and the results from their most recent index (Q1 2013 – more comprehensive than the smaller samplings) tell us that the Housing Price Index for 20 States is less than it was a year ago. Amongst those leading the pack:
|
Rhode Island |
Connecticut |
|
Illinois |
Alabama |
|
New Jersey |
Delaware |
|
Mississippi |
Missouri |
DIVER Analytics, Filter Module, FHFA
Exports – They Do Matter
In prior commentaries, I have touched on the reality that it is indeed a small world and that what happens in other countries doesn’t necessarily stay in other countries. To that end, the US Census Bureau released their June Exports data and we found that 29 States have seen a decline in their exports as compared to one year ago. Think tax revenue and jobs. Comparing this group to the States noted above in our Housing section, a few that make both lists (but not all) Connecticut, Illinois, Alabama, Missouri and Rhode Island.
Bringing It Together – What’s the Score?
In recent commentaries, I have introduced the Geo Score, a proprietary scoring of the economic well-being of a given geography at a point in time. The Geo Score takes into consideration a series of factors across the Employment, Housing and Income data groups and our data team performs the analysis. Above, I’ve thrown quite a bit at you and challenge the breadth of the recovery. Each of you will make of this data (and other data) what you will. What does our Geo Score say about the States (where 10 represents the strongest economic environment on a relative basis)? Here is a sampling of the top and bottom 10.
Bottom 10Top 10
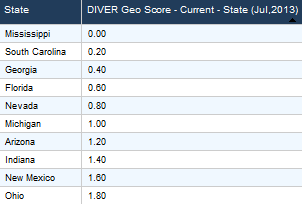
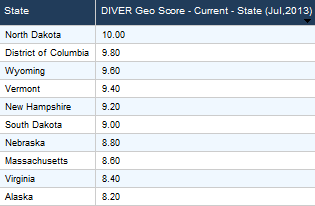
DIVER Analytics, Lumesis Geo Score, Patent Pending.
The Geo Score is also available for every county and over 300 cities.
I’m off on holiday and we look forward to bringing you a guest commentary next week. Have a great week.
Gregg L. Bienstock
CEO & Co-Founder, Lumesis, Inc.
This Week’s Data :
- Weekly Initial and Continued Jobless Claims, State, 7/27/2013
- Exports Total (Monthly), State, June 2013
- UPDATED: Default Filings - Issuers, State, County, 2013
- Delinquency Rate (Res. Mortgage), State, June 2013
- UPDATED: Bankruptcy Filings - Issuers, State, County, 2013
© Lumesis


