Last week’s summer storm warning for the stock market has so far yielded just a few summer showers. Both the Dow and the S&P 500 tumbled, but with stronger-than-expected earnings reports across much of the tech sector, the NASDAQ Index moved higher last week.
Yes, earnings continue to dominate stock market headlines. With about half of the companies reporting, this reporting period is turning out to be better than expected. About 65% of company earnings are beating analysts’ expectations, while 56% are outperforming on a revenue basis.
While it is disappointing that more stocks are not rallying beyond the tech sector-laden index, it is probably that stocks are not getting much assistance from economic reports that are always being reported. Last week, for example, of the eleven that were reported, only five beat expectations. On the positive side, though, Consumer Confidence hit its highest level since 2007. Since this index tends to lead the stock market (see chart below), this is good news longer term.
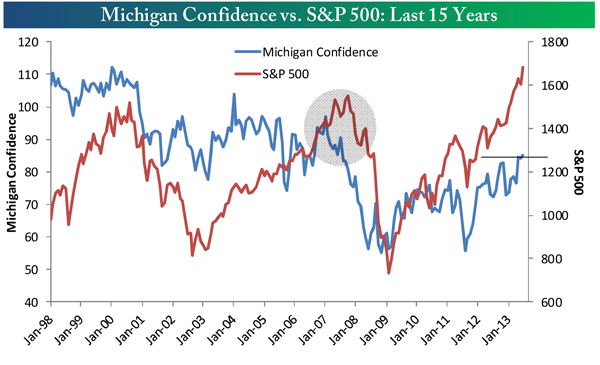
Source: Bespoke Investment Group
Next week 33 reports are expected, and while we can hope for the positive, it’s likely to be volatile. Of course, volatility can be positive or negative. We have the monthly employment report on Friday and the Federal Reserve Report on Wednesday. Both have sent shock waves through the financial markets in past months this year.
Fortunately, this week tends to be positive in seasonality terms (unlike August as a whole, which has been negative on average over the last twenty years). Additionally, last week we indicated concern over the extreme overbought nature of the S&P 500 Index. With the decline over the last week, we are now only mildly overbought.
While interest rates were positive throughout most of last week, leading bond prices higher, rates turned up on Friday, causing price slumps across the bond market that day. The retracement in rates that we have seen throughout this month has been one of the supporting factors behind the July stock market surge back to new highs (an all-time new high was hit on the Dow Jones Average just last week). So any continuation in the upturn in rates will bear watching.
Finally, we have been very encouraged by the turnaround in the gold market. Gold outperformed the stock indexes last week and so far for the month of July. Since we brought out the world’s first non-ETF gold bullion mutual fund on July 8th, gold prices have soared over 7%. In the same time span, the S&P has gained a bit over 3%. Our Hedged Gold Bullion strategy, which is a very conservative gold tracking vehicle (at most only 50% is ever invested in Gold), has risen a bit over 1.5% in the last three weeks.
Of primary concern to us, as sub-advisors on The Gold Bullion Strategy Fund (QGLDX), is that it tracks the price of gold. As the chart shows, it has done very well.
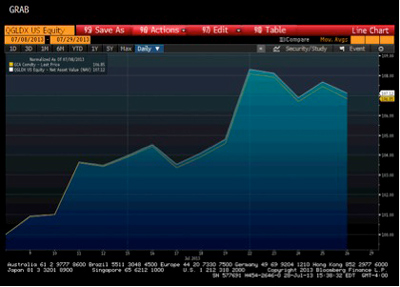
Source of Data: Bloomberg, Yahoo! Finance (QGLDX) and EODData.com (GC)
When we brought out the Fund, I wrote how this was a particularly good time to own gold. The yellow metal had fallen 35% and in the past had not fallen more than 10% from that level. Last week the price of gold topped its 50-day moving average, usually considered a bullish technical signal. Also I note that the second half of the year tends to be positive for gold. Even in the gold bear market from 1981 to 2000, gold managed to average a gain in the second half of the year.
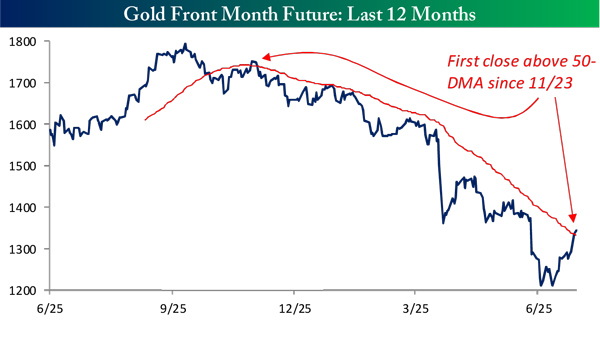
Source: Bespoke Investment Group
Last week, Federal Reserve Chairman Bernanke told Congress that he “…did not understand gold.” It seems like that’s like a weatherman not understanding the difference between sunshine and summer showers.
All the best,
Jerry
© Flexible Plan Investments


