Last week, I left you with a hint that the July 8 commentary was to be a collector’s edition. After reading this week’s you will know why (hint: it is in the title). I start this week with a guest commentary from Kate McDonough who takes a look at the Detroit Emergency Manager’s Proposal for Creditors. I then take a look at just how reliant we are on the Federal Government for revenue (beyond what the Federal Reserve is doing). For those that print, this week’s commentary will print a bit longer due to a few more tables and graphics.
Tidbits :
Growth Estimate Pared Back – Last week, the White House’s mid-session review of the budget lowered the expected growth of the economy from 2.6% to 2.4% and highlighted the sequester as well as slower growth in China and Europe (recall our June 10, 2013 commentary where we discussed “its a small world”). The Congressional Budget Office takes a dimmer view --- 1.4% growth for the year and unemployment averaging 7.9%. The difference in the projections? The White House assumes the President’s tax and spending proposals will become law. Given Congress couldn’t agree on continuing the food stamp program as part of the Farm subsidy bill and they couldn’t agree on student loans, the White House assumption is as likely as my Mets winning the World Series this year.
Tax Reform: What I Heard – I recently attended a roundtable where a retired Congressman offered his views on tax reform and why something WILL happen this year. “Somehow, sometime there is going to be tax reform” and rest assured, “everything is fair game.” With the inevitability of the need to address the debt ceiling, the deficit, maybe adopting a budget and some House and Senate leadership terms coming to an end there will be enough impetus to get something out there – so he says. Also, look for high tax States to suffer more than others. As such, if an issue is near and dear to you, speak now or forever hold your complaints – tax exemption and deduction caps should come to mind. Call your Congressional representatives if you have a view. Not my view but that of a retired Congressman who longs for the days of back room deals and getting things done in DC.
City of Detroit – A look at the Proposal for Creditors issued by the Office of the Emergency Manager.
By Kate McDonough, Advisory Board Member
Reading the Proposal for Creditors issued by the Office of the Emergency Manager for the City of Detroit last month, my attention was drawn by something other than the controversial idea of treating general obligation debt as any other unsecured obligation. While this novel approach is rightfully generating much discussion and concern, I was struck by the emphasis the City placed on the strong economic headwinds it faces. The City’s discussion of its challenges started not with budget or financial performance, but with the economic and demographic indicators they identified as the drivers that have adversely affected the City and contributed to its current state of insolvency.
Looking at the indicators cited, I wondered what other cities might be facing these particular headwinds, and if those factors might have something to say about the future financial challenges those issuers may face.
The following chart compares economic and demographic data of Detroit to several other cities with similar ratings. Below, we also compare Detroit’s DIVER Geo Score with the other cities.
|
Detroit |
Atlanta |
New Orleans |
Miami |
|
|
DIVER Geo Score (Current/Trend) |
0/6.7 |
1.3/6.8 |
4.4/3.1 |
0.2/4.8 |
|
Unemployment Rate (Dec. 2012) |
18.1 |
10.9 |
6.6 |
10. |
|
Poverty Rate (2011) |
40.9 |
26.2 |
28.9 |
31 |
|
Assessed Value Change (2009-12; County level data) |
-19.8 |
-13.6 |
24.3 |
-14.5 |
|
Property Tax as % of income (2011; County level data) |
4.5 |
3.3 |
2.2 |
4.5 |
|
Median Household Income Change (20101-11) |
-2.3 |
5.46 |
-7.12 |
4.56 |
|
Business Vacancy rate (Q3 – 2010, County level data) |
16.6 |
14.9 |
25.1 |
12.6 |
Surprisingly, Atlanta, a AA rated credit, did not fare as well in some of these measures as New Orleans (A category) or Miami (BBB category). While other factors, including most prominently, fiscal management enter into the rating agencies judgment, it has become more evident through this latest period of economic challenge that the economic and demographic characteristics of an issuer are key determinants of how successfully challenges can be met. When incomes are declining, property tax burdens and business vacancy rates are high and unemployment rates exceed the national average, the ability of any issuer to respond to fiscal challenges can become limited, as it has in Detroit. This is not to suggest that any of these highlighted cities are heading down the same path, but rather a reminder that a rating may not tell the whole story behind a particular credit.
Addicted to Federal Funds
Earlier in this commentary, I alluded to the reality that many don’t want to face – despite revenues to date exceeding the White House’s initial projections (we covered the “why” previously), the Administration and Congress will have to address the deficit, debt ceiling and tax reform. In fact, while the media hasn’t focused on it just yet (why ruin a perfectly good summer), the Sequester order for 2014 has already been signed. This leads me to a stark reality we all should seriously contemplate: What if the Federal government actually cut spending? Would it really impact States, counties, cities and school districts of interest to you? My belief: more than you have truly contemplated.
Some baseline data to consider. When we look at Federal Funds as a % of State Revenue we find that 33 States get more than 33% of their revenue directly or indirectly from the Federal Government. Illinois and Connecticut are the lowest – interesting that two States facing scrutiny these days take much less than others. Equally alarming (at least to me), only four States receive less than 25% of their revenue from the Federal Government-- CT, DC, IL, WA.
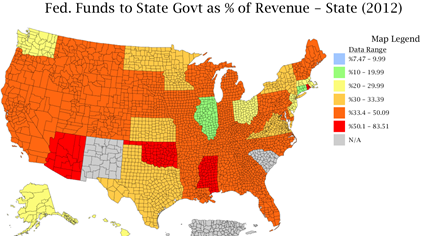
DIVER Analytics, Map Module
As the subject of deficits, debt ceiling and tax reform heat up, this data will be critical to any municipal analysis. If you are interested in accessing data from the State to zip level about Federal spending – where it goes and in what form – contact us as we have amassed a database that is updated monthly. Much of the data is accessible in the DIVER Platform but comprehensive exports are available as well.
Given what we heard this week re tax reform, another reminder, we encourage all of our readers (and pass this on) to let your Congressional representatives know how you feel about muni tax exemption. Also visit the Municipal Bonds for America site, http://www.munibondsforamerica.org/ and “sign” their petition.
Have a great week.
Gregg L. Bienstock
CEO & Co-Founder, Lumesis, Inc.
This Week’s Data :
- Weekly Initial and Continued Jobless Claims, State, 6/29/2013
- Drought Intensity, County, 7/9/2013
- Foreclosures, County and State, June 2013
- NEW: DIVER Geo Score, State and County, Jan 2012 through Jul 2013
- UPDATED: Fed. Funds Received, State and County, 2013
- Delinquency Rate (Res. Mortgage), State, May 2013
- UPDATED: Default Filings - Issuers, County, 2013
- UPDATED: Special Event: Tornadoes, County, 2013
© Lumesis


