“The Employment Situation” – The first Friday has come and gone. Initial reports were seemingly positive and then, I think, people read the report or they simply were shaking off the cobwebs from their Independence Day celebration. As always, we await the more detailed State, county and city numbers to avoid revisions to data of up to 30%. Nevertheless, some “beyond the headlines” facts for you. Unemployed persons and rate, unchanged; long-term unemployed, unchanged; labor force participation rate, unchanged; employment to population ratio down. And now the news that makes me most concerned, the number of persons employed part-time for economic reasons (involuntary part-time) increased by 322,000. Consider this in light of the reality that the payroll number increased by 195,000. Not all it is cracked up to be. Keep an eye out for wage data and, as noted last week, tax receipts in the coming months.
Defaults – “It depends on what the meaning of the word [defaults] is.” Last week, two publications reported on data regarding defaults for 2013 to date and noted that, per our friends at MMA (who, by the way, do outstanding work), 26 local borrowers missed bond payments for the first time in the first half of 2013. No qualms at all. Our data team tracks Defaults and Bankruptcies and updates our data weekly. We, however, take a slightly different view. Namely, if a default event is worth reporting to (or required to be reported to) the MSRB, it is a default. Based on the same, our math is slightly different – 89 Defaults defined as the number of unique issuers that submitted a Principal and/or Interest Payment delinquency filing with the MSRB. In the Bloomberg Brief, Matt Fabian of MMA noted that the “risk of defaults in the market is still extremely low.” We agree. Below is our Average Default Rate against a sample portfolio.
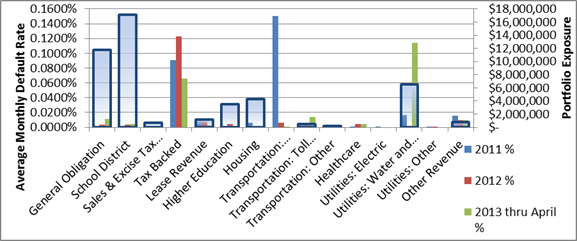
DIVER Data Services; Default Rate by Sector v. Sample Portfolio.
In early June, we spent time looking at GDP Growth and the reality that only 24 States saw growth greater than 2% and only 10 States greater than 3%. A contributor to GDP Growth is, of course, Exports. Lets start with a standard we are all familiar with from our childhood or that recent trip to Disney – it’s a small world after all” – and accept the reality that our exports can suffer from conditions (economic, political, etc.) impacting our trading partners. For the period May 2013 vs. May 2012, only 16 States have seen Export Growth. Taking this a step further, of the 24 States that saw GDP Growth, only 15 had Growth in Exports. Source: DIVER Analytics, Filter Module; US Census Bureau. While one can argue, growth from within is good (no need to rely on others), it is a small world. Trading partner identification, global economic woes and recoveries and the monetary policy of the US and out trading partners all will impact these factors. For identification of Top Export Partners, DIVER’s State by State data widgets will be of service.
Periodically, one of our readers will come back with a comment or two around my having a “glass half empty” perspective. To the contrary. I try to avoid anything more than delivering facts and offering a perspective to contemplate beyond what the mainstream media reports. We leave the crystal ball gazing to others who are much smarter than yours truly. To that end, this past week also saw the release of the Philly Fed’s Leading Index which takes a look at the predicted six month growth rate of each State’s Coincident Index.
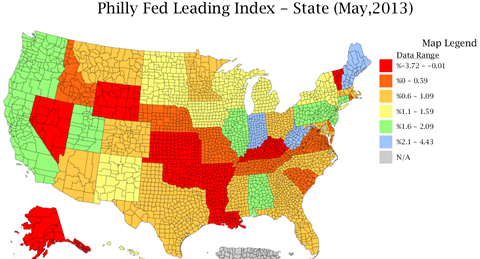
DIVER Analytics, Map Module; Fed. Reserve Bank of Philadelphia.
Our picture, their data. Predicted six month growth rate is greater than 2% in all of three States. The reds are negative. To round this one out, I offer up the Muni Index Trend Score, our look at, on a relative basis, how the States are trending. In a few cases, it looks like the Philly Fed is predicting things will begin to turn for a few States that have shown a negative trend based on data to date. Before you bet the house, please consider the Feds record on predictions.
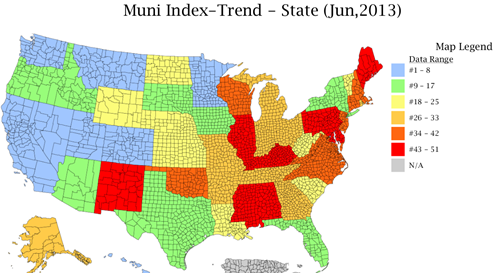
DIVER Analytics, Map Module; Lumesis Data Team.
For those of you wondering what makes this week’s commentary a collector’s addition, we will provide the answer next week.
One last reminder, we encourage all of our readers (and pass this on) to let your Congressional representatives know how you feel about muni tax exemption. Also visit the Municipal Bonds for America site, http://www.munibondsforamerica.org/ and “sign” their petition.
Have a great week.
Gregg L. Bienstock
CEO & Co-Founder, Lumesis, Inc.
This Week’s Data :
- Exports Total (Monthly), State, May 2013
- Job Growth, County, May 2013
- Philly Fed Leading Index, May 2013, State
- Unemployment and Unempl. Rank Change, May 2013, County
- UPDATED: Muni Index, Pt. in Time/Trend, County, July 2013
- FEMA Disasters, County, June 2013
- UPDATED: Bankruptcy Filings - Issuers, County, 2013
- UPDATED: Special Event: Tornadoes, County, 2013
- UPDATED: Default Filings - Issuers, County, 2013
© Lumesis


