Headlines, Patience, Pensions, Tax Collections, Income and Send a Letter!
Muni Tax Exemption – Justification Please: Back in the news. As Congress makes another run at overhauling the tax code, the Senate Finance Committee had a pretty good idea – let’s start with a “blank slate” when it comes to deductions, exemptions and credits. The Committee has asked Senators for proposals around deductions and exemptions and to support the same. Write your Congressperson and revisit our April 8 Commentary on the subject. Also visit the Municipal Bonds for America site, http://www.munibondsforamerica.org/ and “sign” their petition.
Economic Numbers Revised – Patience Is a Virtue : Last week, the Commerce Department released numbers showing a sharp downward revision to first quarter growth – 1.8% expansion in Q1 vs. 2.4% estimated one month ago. “Releasing reports based on incomplete data isn’t unusual for government agencies, considering the demand by investors and policy makers for up-to-date snapshots of the economy’s performance. Rather it is a trade-off between timeliness, accuracy and relevance…” Sluggish Consumer Spending Drags Down 1st-Quarter Growth, WSJ, 6/27/2013. Should you sacrifice accuracy for speed?
A Little Volatility: About ten days ago, after Chairman Bernanke spoke, the markets tanked as many believed the Chairman when he said that the beginning of the end of QE was in sight. Apparently the Chairman was ahead of himself. This week, Fed officials are telling folks they misunderstood Ben’s statements last week. In defense of the Fed Chairman (not something I say often), recall last week we were of the view the market had overreacted given the qualification of the Fed Chairman’s statement with the “If” word. If the economy continues to strengthen… In our view, the Fed knows that the market hangs on their every word, particularly during this period of extraordinary easy money policy. With language being carefully selected, they were likely making an attempt at a very soft introduction of the concept that rates will not be zero forever and a change in direction is coming.
Pensions and that New Report: Earlier this week, Moody’s released their report on pensions and, according to Bloomberg, Moody’s concluded that underfunding of State pension plans grew worse – using their new methodology, to 48% from 74%. The Moody’s report, unfortunately, uses 2011 data when 48 States have already reported data for 2012. If you would like access to the underlying individual plan data for 2012 for States (and cities with populations greater than 100,000) that have reported, let us know. [email protected]. One other note on a quote in the Moody’s report that warrants a comment. The quote: “States that have the largest relative pension liabilities have at least one thing in common: a history of contributing less to their pension plans than the actuarially required contributions.” Comment: Not terribly Insightful.
Two quick Pension maps for you. Funded Ratio on the left and ARC Paid on the right.
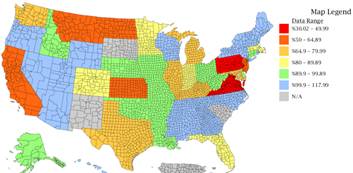
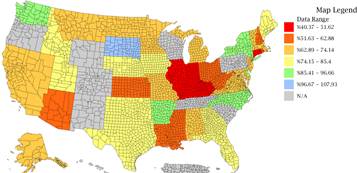
DIVER Analytics, Map Module; State CAFRS.
Tax Collections and Personal Income – A couple of weeks back there was much ado about projected 1Q tax receipts exceeding expectations and being up for virtually all States. Well, the actual numbers were released this week and, despite tax receipts being goosed by folks pushing revenue into 2012 to beat the tax hikes (I mean expiration of certain tax cuts), there are nine States that saw their Taxes Collected and Taxes Collected Per Capita decline and seven that saw their Income Tax Collections decline. There are three States (Alaska, Delaware and Kentucky) that win the prize for meeting all of the criteria.
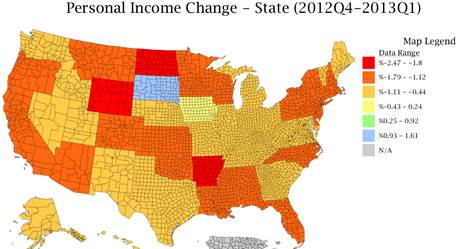
Standing alone, one may be less concerned as this is a small number of States and, according to certain government figures and the Fed Chair, the economy is growing (wait, it is growing slower than projected a month ago and the Fed Chair used the word “If” and was backstopped by other Fed officials this week). However, I have some cause for concern (on top of rich people pushing income to Q4 2012). On Friday, the BEA released data around Personal Income for the 1st quarter of 2013. Some sobering numbers but, alas, something for the glass half full crowd as well:
- State Personal Income declined an average of 1.2% in the first quarter (after growing 2.7% in the fourth quarter – did that have anything to do with income being moved to Q4?).
- State Personal Income Change was greater than zero (in other words, up) in ONE State (yes, only one) compared to 4Q 2012 – South Dakota. The map below is painful to look at and think about as we contemplate the next report on Tax Receipts
- Not all is lost, Personal Income Per Capita is up across the board when compared to 1Q 2012
As one contemplates the “growth” of the economy, the “growth” in employment and the “growth” in tax receipts, it is critical that we heed the word of Chair Bernanke – “If”.
One last reminder, we encourage all of our readers (and pass this on) to let your Congressional representatives know how you feel about muni tax exemption.
Have a great week and Happy Independence Day.
Gregg L. Bienstock
CEO & Co-Founder, Lumesis, Inc.
This Week’s Data :
- Recovery Act Contracts, Grants, Loans, and Funds Received, State, Q1 2013
- UPDATED: Muni Index, Point in Time and Trend, June 2013, State
- Personal Income $, Personal Income Change, Personal Income per Capita, State, 2013 Q1
- Employment by Industry, State, County, 2012 Q4
- UPDATED: Percent of ARC Paid, State, 2012
- UPDATED: Muni Index, Pt. in Time/Trend, County, June 2013
- Weekly Initial and Continued Jobless Claims, State, 6/15/2013
- UPDATED: ARC as % of General Fund Revenue and Expenses, State, 2012
- Coincident Index Change, May 2013, State
- Tax Collections by Category, State, 2013 Q1
© Lumesis


