Inflation Lags Monetary Expansion: Prepare to be Swindled
In May 1977, the consumer price index (CPI), which measures a basket of consumer goods in the U.S. economy, had risen 6.7% from the year before. The indexes had doubled over the previous 15 years, and by 1977 investors were fully aware that the rate of change was increasing—i.e. the inflation rate was spiraling higher. By then, this inflationary awareness had worked its way into every corner of the financial markets, as commodities, gold and interest rates rose, and the stock market remained in a deep funk. The S&P 500 stood at 98, the same nominal price it was 9 years earlier, in 1968; however, this nominal price represented a 42% decline when adjusted for the rise in the CPI over that time, reflecting a significant loss of real purchasing power.
With stock prices having lost almost half their inflation-adjusted price in the previous decade, and with inflation rates still climbing (the year-over-year change in the CPI would peak at over 14% in 1982), investors were abandoning stocks. The 10-year P/E of the S&P 500 in May 1977 stood at 10.6, which was down from the peak at 24 in 1966. This 56% decline in the market’s valuation was a “vote of no confidence” by investors in the ability of stock prices to offer a positive inflation-adjusted return in the years ahead—and they were right. In the 5 years that followed, the CPI would rise another 59%, but the S&P 500 would rise only 18% and drop to a 10-year P/E of 7.9– handing investors another 26% inflation-adjusted decline in price.
In the midst of this market turmoil, Warren Buffett published an article in Fortune magazine that in many ways captured the mindset of investors at the time, and offered a clear illustration of why stocks do poorly in an environment of rising inflation rates. We’ve linked a PDF copy of the full article below, and recommend reading at least the first 5 pages for a primer on why valuations declined leading up to 1977 (although the entire article is well worth a read).
How Inflation Swindles the Equity Investor—Warren Buffett, Fortune 1977
Although he may or may not have intended to frame it this way, in this article Buffett offered a succinct summary of some of the underlying dynamics behind the 1949–1966 long-term bull market, and the subsequent long-term bear market that lasted from 1966 to 1982. During the bull market, investors bid up the valuation of stocks because inflation rates were low and the return from retained earnings far exceeded the return on bonds and other fixed-income investments. As the market’s valuation increased to over twice book value, the return investors received on retained earnings declined; a 12% equity return in the underlying business, when adjusted for a price 200% above book value, equates to a 6% equity return based on the then-current market price. But because that return was still higher than the return on bonds, and the inflation rate was low, investors were happy and the market’s valuation stayed high throughout the early and mid-1960s.
However, as Buffett describes in the article, following the peak valuation that was reached in 1966, there was a reversal in the process of marking up the valuation of the market with the expectation of continued low inflation, and a higher return from retained earnings than prevailing interest rates and other competing investments. The bull market ended, and the bear market began.
Although we don’t know today what most investors were thinking at the time, it’s clear from the market’s valuation in January 1966—trading at 220% of book value and with a 10-year P/E of 24—that the going assumption was that inflation would stay low, and the rates of return from bonds, commodities and other potential investments would also stay as low as they had been leading up to 1966. Stocks were valued as high as they were in 1966 only because inflation was below 2% and there were no competing investments that offered a higher rate of return than stocks did—and in order for the market to remain at that high valuation, it had to remain that way. But what happened following 1966 is a story you are probably familiar with: consumer price inflation rates started to rise, and all markets—stocks included—began revaluing themselves lower as investors demanded higher returns in light of increasing inflation.
The inflation-adjusted price of the S&P 500 would not rise above its January 1966 level until 26 years later, in 1992. Investors who continued to hold on to stocks after 1966 continued to see their nominal account balances remain intact as, despite several steep selloffs, the nominal price of the market held up throughout the bear market. However, by the end of the bear market in 1982, the S&P 500 had lost 62% of its inflation-adjusted price (i.e. it lost 62% of its purchasing power)—a loss on par with the previous long-term bear market, during the Great Depression.
Monetary Expansion Eventually Leads to Consumer Price Inflation
While the inflation of the 1970s and early 1980s was dramatic, it was not the first time the economy had endured a significant inflationary rise in prices. And in fact, it was not the first time the stock market’s valuation had declined substantially to reflect the lowered returns investors receive when prices enter an inflationary rise. This had all happened before. However, because the last time a similar market dynamic had occurred was more than three decades prior, the vast majority of investors at the time had no memory of it.
In January 1966, when the market reached a peak 10-year P/E of 24, the year-over-year rise in consumer prices was 1.9%. This benign reading was the latest in more than a decade of low consumer price inflation rates, in which the CPI never rose above 3% year over year from 1953 onward. This low-inflation environment had existed for long enough to convince investors that it was more or less permanent, and this sentiment manifested itself in the high market valuation at the time. However, an important change not yet priced into the market was that the Federal Reserve’s monetary base, which had remained stagnant after WWII, had recently begun to grow again.
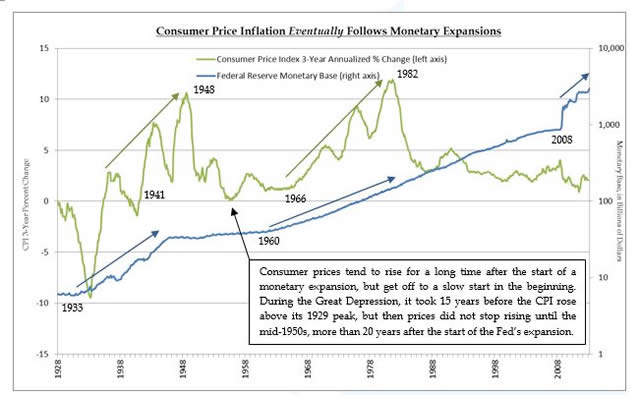
After remaining relatively stable in the 15 years following WWII, the Fed’s monetary base began to expand at a higher rate beginning in 1960. By 1966, the 28% monetary expansion over the previous 6 years began to show up in a slightly higher annual increase in consumer prices. Although the early rate changes were small, with hindsight it is clear that after a 6-year lag, consumer prices began following the monetary base higher. This can be seen in the middle of the chart below, which shows the Fed’s monetary base in blue and the 3-year annualized change in the CPI in green.
Consumer prices tend to rise for a long time after the start of a monetary expansion, but get off to a slow start in the beginning. During the Great Depression, it took 15 years before the CPI rose above its 1929 peak, but then prices did not stop rising until the mid-1950s, more than 20 years after the start of the Fed’s expansion.
Looking back, from atop the bull market in 1966, it may have been easy to either dismiss the comparatively modest rise in the monetary base between 1960 and 1966 as inconsequential, or conclude that higher inflation rates, if they ever came, were likely many years down the road. In either case, as the market rose into 1966, it may have seemed that equity investors had little to worry about with regard to inflation.
In fact, it was at just that moment, when the Fed was expanding the monetary base, but the CPI-measured inflation rate and interest rates were still low, that risk in the stock market was at its highest and potential returns going forward were the lowest. The reason is that during the Great Depression, and during the 1966–1982 bear market, the market’s valuation anticipated higher future inflation rates by starting to decline years ahead of any visible inflation problem, and valuations stayed low until the peak rates of CPI inflation had come and gone.
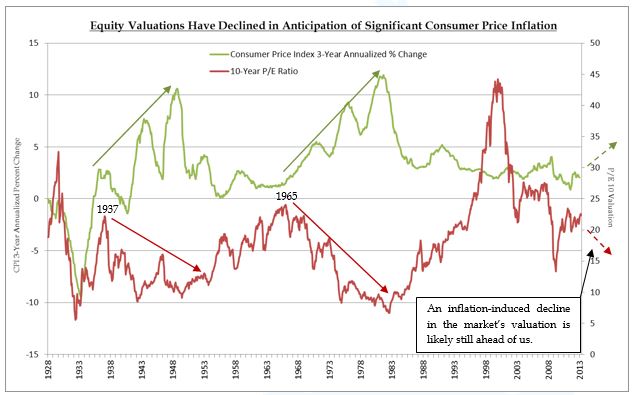
This can be seen by the red arrows in the chart below. During the Great Depression, the market’s valuation fell from 1937 onward, even though the economy remained in deflation at the time and the peak rate of inflation was still 11 years away. The peak valuation in 1966 occurred with the year-over-year CPI change below 2%, and the peak rate of inflation 16 years away. Investors who considered only current inflation data, and didn’t consider the long-term impact of the Fed’s monetary expansion, were likely at a loss to explain why the market began declining in value.
A big part of our continued caution regarding the stock market recently is that, due in part to the Fed’s ongoing quantitative easing, the market appears poised for another decline in valuation over the coming decade. The stock market today is making a number of the same optimistic assumptions, implied by its current 10-year P/E of 23 and price at 240% of book value, that it did in 1966 and 1937. Chief among these assumptions is that the Fed can continue its monetary expansion indefinitely, without significant inflation arising in the future. This has been the case since 2008, as the private economy has continued to deleverage, and it has especially been the case over the past two years as the global economy has slowed significantly. These forces have all contributed to a low consumer price inflation rate.
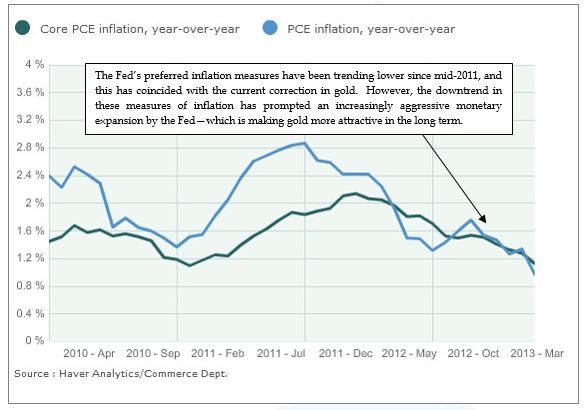
The Fed’s preferred inflation measurement, the Core PCE, depicted in the chart below, has fallen from a high just above 2% down to 1.2% over the past two years. This fall in measured inflation has coincided with a decline in gold, a further rise in the stock market, and the introduction of QEnfinity—the Fed’s ongoing, open-ended purchase of $85 billion a month of Treasury and mortgage-backed bonds from the open market. The Fed’s balance sheet now stands near $3.3 trillion, and it continues to expand by $85 billion every month as the Fed seeks to keep interest rates low, keep inflation rates positive, keep the economy growing and the housing market rising.
The Fed’s preferred inflation measures have been trending lower since mid-2011, and this has coincided with the current correction in gold. However, the downtrend in these measures of inflation has prompted an increasingly aggressive monetary expansion by the Fed—which is making gold more attractive in the long term.
With its preferred measures of inflation still low, with unemployment still relatively high, and with the economy still highly leveraged and growing ever so slowly, the Fed is well aware of the risks inherent in allowing inflation rates to turn negative again with such a high debt overhang. The Fed wants inflation rates to stay positive and prices rising in the coming years, because in its view that will alleviate the real debt burden in the private economy (especially in the housing market) and enable the government to better afford its substantial debt burden.
Yet, as investors we have to realize that the market conditions today, defined by a rapidly expanding monetary base along with low measured rates of consumer price inflation and low interest rates, are likely only a temporary window of Goldilocks conditions for the stock market. At some point these market conditions will change, and if history is any guide, we may see the market, at any time, begin to reverse its current optimistic assumptions that this environment will continue indefinitely—even if significantly higher rates of inflation are many years away. When that process begins, the downside risk to the market, on both a nominal and inflation-adjusted basis, will likely be substantial from current valuations.
Investing Based on the Market’s Valuation Leads to Higher Returns and Lower Volatility
Only a small number of investors maintain the fortitude and client confidence to pursue long-term investment success even at the price of short-term underperformance. Most investors feel the hefty weight of short-term performance expectations, forcing them to take up marginal or highly speculative investments that we shun. When markets are rising, such investments may perform well, which means that our unwavering patience and discipline sometimes impairs our results and makes us appear overly cautious. The payoff from a risk-averse, long-term orientation is—just that—long term. It is measurable only over the span of many years, over one or more market cycles.
Seth Klarman
As we profiled in our letter last July, Seth Klarman has been one of those rare value investors who has successfully mixed a bottom-up value approach with an acute awareness of macro themes and broader market risks. He is also an investment manager that described his year in 2012 as being “all dressed up with nowhere to go,” as he ended the year with over 30% of his portfolio in cash waiting for the market to deliver better investment opportunities once the current euphoria subsides and valuations are more attractive.
At this stage of a market cycle, the performance of value-oriented investment managers can be the most confusing to clients. Because the market is still rising, and nearly everyone is aware that the market is still rising, it can be mystifying why a manager isn’t invested and reaping the gains from the rise. It seems so easy to make money in this type of environment—all one has to do is buy stocks and feel the tailwind. Of course, from a broader perspective it is never a good sign when making money in stocks feels easy. It is a sign that stocks have become so popular that an enthusiastic herd is driving the market to an extreme, which can create gains in the short-term, but at the expense of introducing a high risk of significant loss once the herd decides to change course.
Faced with such an environment, good value-oriented managers often decide that it is better to exit early, before the herd begins to stampede for an exit, knowing that investment opportunities far more attractive will eventually follow. It is a simple judgment call of the potential risk entailed in staying in the market too long when investors are euphoric and valuations are high, versus the potential reward of waiting for better opportunities after sentiment sours and valuations provide a higher, safer potential forward return. After a certain point, the potential return of an overvalued market doesn’t justify the increasing risk.
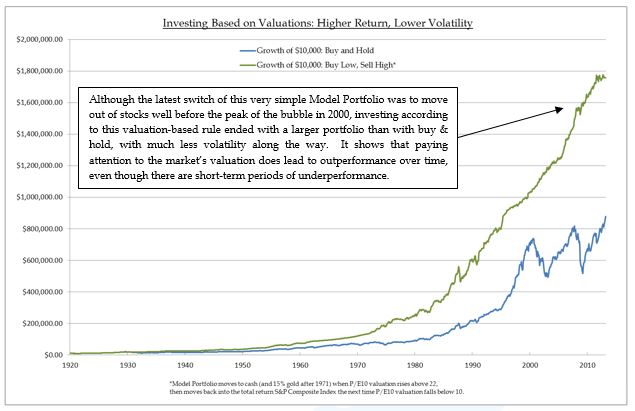
As a demonstration of how high market valuations lead to more risk than return, the chart below shows the performance of a hypothetical portfolio that walked away from any additional gains in stocks when valuations were high. This simple valuation-based model, which allocated 100% to cash and earned the 3 month treasury yield (and 15% gold after 1971) any time the 10-year P/E of the S&P 500 rose above 22, and then waited for the 10-year P/E to fall to 10 before getting back into stocks, by no means timed the market perfectly. However, in the end the return of this portfolio was higher than a buy-and-hold approach, because by selling at high valuations the portfolio avoided the negative returns that inevitably followed when the market was overvalued. It shows that avoiding negative returns by shunning stocks when valuations are high not only increases long-term returns, it also reduces risk and volatility.
In addition to exiting markets that are expensive and popular, another thing value-oriented managers often do when faced with an environment like we have today is to move into markets that are cheap and unpopular. This can cause even more confusion among clients, because markets that are cheap and unpopular are almost always not rising with the markets that are expensive and popular—and, in fact, they are sometimes still in the process of becoming cheaper. This not only leaves clients wondering why their portfolio isn’t rising with the popular markets, but wondering how their portfolio could be declining in such an environment.
While in the short term it may not feel as exciting as riding an expensive market higher, conditions like we have today have us, as value-oriented managers, feeling quite good about how we are positioned. This is because we are currently not exposed to the risks (and the limited potential return) associated with an expensive stock market, and are instead holding a significant amount of cash as well as being invested in assets that we feel are cheap and have a high potential return in the years ahead. This combination, a low or negative exposure to expensive, popular markets, and high exposure to cheap, unpopular markets, is what tends to lead to long-term out-performance, and it’s how we are positioned today.
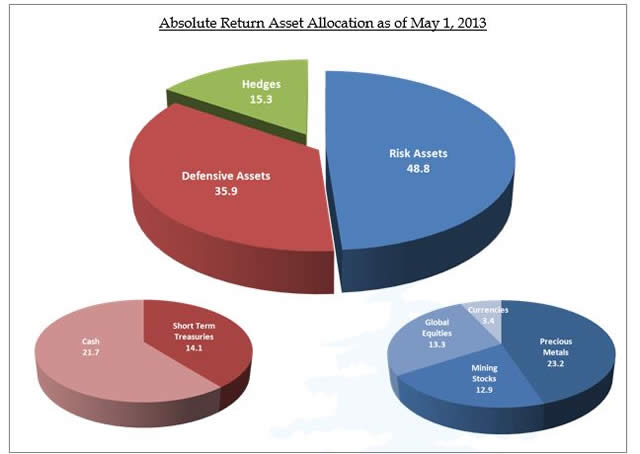
The current allocation for Absolute Return outlined above is in line not only with the long-term risks and opportunities we see, but it is also in line with our assessment of the short-term risks and opportunities in the current market environment.
As we mentioned previously, investors appear to be in the middle of a desperate search for yield, and this has driven up the price of nearly every asset with a yield perceived to be “safe”—and even many assets that aren’t safe at all. Not only have “safe” stocks like Johnson & Johnson and Eli Lilly & Co. gone through parabolic rises over the past year, entire yield-oriented market sectors like Utilities have done the same. In addition, yields in junk bonds are now at historic lows, showing that this hunt for yield by investors has reached such a point that the quality of the asset is far less important than the fact that it has a current yield higher than the near-zero return on cash. If you remember the frenzied search for yield by investors in the mortgage bond market—regardless of the quality of the debt—in the years before the housing bust, this should sound all too familiar.
In the face of this, the Fed is becoming more aggressive in its pursuit of creating inflation, in order to reduce the real debt burden in the housing market and the government—and it has a very long way to go. In the markets today, there is a built-in expectation of continued monetary expansion by the Fed without significant consumer price inflation, which is the main reason why the S&P 500 trades at such a high valuation today. However, history strongly suggests we can’t have both of these trends forever—eventually, the Fed will have to reverse its monetary expansion, or significant price inflation will begin to emerge. In either case, market valuations will likely fall in response.
In some circumstances, unless investors are prepared ahead of time, there isn’t much of a chance to make changes once the herd begins heading for the exit. As we have seen in Japan over the past 6 months, sometimes these inflection points come quickly—and the markets never look back. In our estimation, at some point the U.S. market will likely begin discounting higher future inflation, but that inflection point will only be clear in hindsight. In this context, with the S&P 500 now trading with a 10-year P/E above 23, there is far more risk than potential return at this level.
There have been times when we invested in ways that were counter to long-term trends, in order to take advantage of short-term opportunities. However, the current market conditions leave few appealing short-term opportunities, and so we are currently invested with an allocation that is not only our best response to the short-term market environment, but is also aligned with trends we see playing out over the coming decade. We feel we are well prepared for the market conditions we’ll likely face in the years ahead.
As always, if you have any questions about topics discussed in this letter, feel free to contact us—we’d be glad hear from you.
Sincerely,
Sitka Pacific Capital Management, LLC
The content of this letter is provided as general information only and is not intended to provide investment or other advice. This material is not to be construed as a recommendation or solicitation to buy or sell any security, financial product, instrument or to participate in any particular trading strategy. Sitka Pacific Capital Management provides investment advice solely through the management of its client accounts.
© Sitka Pacific Capital Management


