This week I decided to try something new – think of it as the appetizer, dinner and dessert. The appetizer is our section of Tidbits, a look at some headlines and a thought or two around the same. The meal is where we take a deeper dive into a subject or two and dessert is where we round things out – what’s new, what’s coming up and the like. If you don’t like the new format, let me know.
Tidbits:
- Detroit to Halt Payments on Unsecured Muni Bonds. As reported by the Bond Buyer, Detroit will stop making payments on its unsecured bonds, including a $39.7 million payment due on its pension obligations due this past Friday under a restructuring plan released last Friday. (For the record, we do track all Defaults and Bankruptcies and update the same weekly in our database – you’d be surprised, really). Will be interesting to see how this unfolds – bondholders v. pension plan beneficiaries. What impact will this have on the Funded Ratio of the GRS and PFRS (the two pension systems that otherwise looked relatively ok from a Funded Ratio perspective)? Devil is in the details – our Data Services platform makes available Pension Data right down to the Plan level for all States and cities with populations greater than 100,000.
- Housing. We saw a story or two pointing out that Foreclosures are up for the month of May and that is good news about the housing market! The reason cited had to do with there being limited supply (because so many people are buying before the Fed hikes rates – not happening any time soon; one man’s opinion) which is leading banks to move forward on pending foreclosures. While we do not profess to know the reason, one should surmise that the answer du jour (seemingly required for every bit of data) –may not always be quite so simple (think unemployment rate and the need to look beyond the Household Survey and to also focus on the labor force). As it relates to Housing, we remind readers that in April, all was well in the housing market because Foreclosures were at their lowest point in years. Hmm. We refer you to our May 6 Commentary [please add link] that looked at Homeownership Rates and our April 15 Commentary [insert link] that addressed Delinquency Rates and Foreclosure Percentages (for the most updated data, check out the DIVER platform).
- MSRB Warns Investors, BDs About Sequestration’s Impact on Direct-Pay Bonds. In case you missed it (not sure where reported) the Sequestration Order for 2014 has already been signed by the President. Grab a copy and go to page 31 for the types of bonds affected.
- I’ll be in St. Louis this week participating on the Municipal Market Compliance and Enforcement Priorities panel that is part of the BDA’s Municipal Securities Regulation Seminar. Not too late to sign up.
Stabilization Funds
There was a bit of press last week around the growth in Income Tax Receipts at the State level. While some headlines screamed “all was well”, a seemingly equal number put up the caution sign and referred to the reality of “wealthy” taxpayers and companies shifting income/dividends to 2012 in anticipation of the tax increases. This has been part of our concerns as some folks get overly excited about tax receipts growth. If there is tax receipt growth and if things are getting better (as opposed to a budget saying we will have surplus if the following occurs), we think it makes sense to look at the all important Stabilization Funds of the States. Beyond the obvious (need to save it for the rainy day) we also want to see how States are responding to changes (and potential changes) in Federal spending habits, pension and OPEB obligations and the restraints they put in place over the past few years.
So, you ask, how do things look today and what do the trends look like?
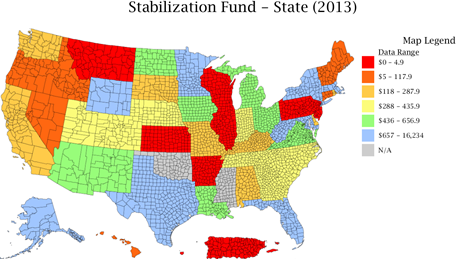
Source: DIVER Analytics, Map Module; NASBO, 2013.
Looking at this another, and perhaps more meaningful, way. We consider the Stabilization Fund as a Percentage of General Fund Expenditures for 2013.
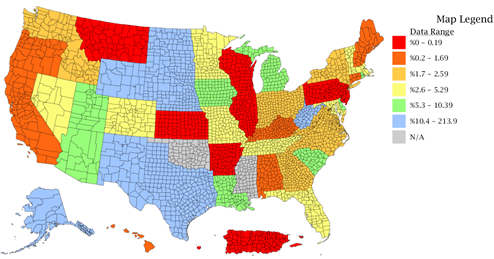
Source: DIVER Analytics, Map Module; NASBO, 2013.
While not 50 shades of gray, we do think it is worth looking at the difference in shading of these two maps – absolute dollars vs. the fund against spending. Now the big question, who has been saving and who has been squandering (not really but it sounded good). To their credit, many States have taken responsible steps over the past few years to control expenses (unlike the Federal government who has quietly put the need to do something about the deficit, sequester and debt ceiling aside because things are, all of sudden, sooo much better – sorry for the diversion).
Stabilization Funds Greater Than 0
|
2014 |
42 |
|
2013 |
41 |
|
2012 |
42 |
|
2011 |
32 |
|
2010 |
34 |
DIVER Analytics; Filter Module; NABO, 2013.
The other barometer is to look at which States are growing their reserves (v simply having reserves) and which are growing the reserves faster than their General Fund Expenditures. DIVER Analytics subscribers can use the Map or Filter modules to quickly find this answer.
Population – More Shades of Gray
Another interesting bit of data was released this week – Population for 2012. While we are half way through 2013, I decided to look at a couple of measures (for the sake of analyzing apples to apples, I used 2012 data). Some interesting data to consider as we contemplate the health of municipalities across the US (no, a single data set at the national level does not really tell much as it relates to our States and more local geographies). Did you know that:
- Of the 963 counties that saw Population Growth of the 18-64 group (working age), only 521 counties saw an increase in their Labor Force and …
- Of the 963 counties noted above, 826 had Job Growth greater than 0 (but only 597 had Job Growth greater than 1%)
- Over 3,000 counties saw growth in the Population of those over 64 ! Speaks for itself.
DIVER Analytic; Filter Module; US Census Bureau, BLS (all data for 2012).
I could spend pages correlating so many of our data sets to the population data – the demographics and corresponding economic data, when looked at together, really provide a picture about what is happening today and what we can expect to happen in terms of tax receipts and spending. CAFRs are good but be careful looking in the rearview mirror when driving forward. Budgets are instructive but the Magic Eight Ball is not always right.
Have a great week.
Gregg L. Bienstock
CEO & Co-Founder, Lumesis, Inc.
This Week’s Data :
- Foreclosures, County and State, May 2013
- Weekly Initial and Continued Jobless Claims, State, 6/1/2013
- UPDATED: Muni Index, Pt. in Time/Trend, County, June 2013
- UPDATED: Muni Index, Point in Time and Trend, June 2013, State
- Population by Age, and Population Change, 2012, State and County
- UPDATED: Stabilization Fund, State, 2012, 2013, 2014
- Drought Intensity, County, 6/11/2013
- Stabilization Fund as % of Expenditures, Stabilization Fund as % of Expend. Change, State, 2012, 2013, 2014
- UPDATED: Default Filings - Issuers, State, County, 2013
- UPDATED: Bankruptcy Filings - Issuers, State, County, 2013
- UPDATED: Special Event: Tornadoes, County, 2013
© Lumesis


