Growth in GDP, A Quick Look at Droughts (Yes, Drought) and Pension Data
I’m simply not going to take the bait and respond to the Employment Situation report. Regular readers know my thoughts around this monthly report that garners way too much attention (take a look back at the May 6 commentary and others around employment data). This week I focus on how and where State economies are growing, remind you of the availability of some critical data points and pass on some observations and opportunities around Pension data.
Where’s the Growth?
I start with a look at GDP Growth at the State level for 2012. The good news is that all States are on the plus side other than Connecticut (we at Lumesis, a Connecticut based company, are trying to do our part – feel free to helpJ). The problem is that only 24 States saw growth greater than 2%, hardly a hallmark of strong economic growth, and only 10 States saw growth greater than 3%. Our concern is the impact of limited growth on tax receipts, employment growth and wages.
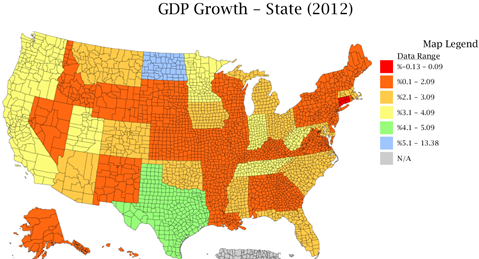
Source: DIVER Analytics, Map Module; Bureau of Economic Analysis
Taking this a step further, GDP Per Capita was assessed. The Results, the Clint Eastwood Classic -- The Good, The Bad and The Ugly : The Good: GDP Per Capita is better in 44 States than it was in 2011. The Bad: GDP Per Capita is better in only 26 States when we compare to 2008. The Ugly: GDP Per Capita is better in only 19 States when we compare to 2007. (Source: DIVER Analytics, Filter Module; BEA and US Census Bureau.) At the State level, we strongly encourage our readers to look at this data in concert with other meaningful factors including Labor Force Participation, Employment (not unemployment) and Income data.
What’s With the Weather?
With the terrible storms affecting Oklahoma and other parts of the country, I want to remind our readers that we continue to track disaster-related data – much of which, unfortunately, stems from some pretty extreme conditions across our country. To this end, while some parts of the country are seeing flood conditions, the Drought Conditions data shows parts of the US suffering from “Exceptional Drought” conditions.
Source: DIVER Analytics, Map Module; Nat’l Drought Mitigation Center
Pension Data - More Comprehensive (and Disconcerting) than Reported
With our crack data team aggregating a huge amount of Pension Data, I thought we would provide a quick update on the Funded Ratio of municipal pension plans that are the responsibility of the States and cities where the population exceeds 100,000.
Before jumping in to the data itself, some stage-setting is in order. About a week ago, the Wall Street Journal ran an Opinion piece by Steve Malanga of the Manhattan Institute. Some interesting quotes:
- One area that has come under special scrutiny is pension-fund accounting, because states have latitude in choosing how to value their retirement debts.
- The SEC accused New Jersey of failing to disclose to investors that it wasn’t sticking to a plan to adequately fund its pension system.
- A June 2012 study by the Pew Center on the States found that 29 states didn’t make their annual required contribution for pension for 2010, the last year for which data were available [Author’s note: Last June, we had aggregated this data for 2011].
- … a survey this January by Pew of 61 large cities found nearly half didn’t make their full contributions [Author’s note: note sure what year is referenced].
What is disappointing is that scholars and the press need to resort to aged data – an unfortunate reality for many of us operating in the muni space (CAFR’s for States and the largest cities are, on average, more than 180 days old by the time they are released). Perhaps that is simply the expectation.
Let me give you something more current to work with. Let’s start with a data point cited above: States that did not make their Annual Required Contribution (“ARC”). For the sake of not short-changing States that came really close but maybe missed a bit due to someone’s math, we used 95% as the threshold for making the ARC.
|
Year |
# Not Making The ARC |
|
2012 |
20 |
|
2011 |
22 |
|
2010 |
23 |
Source: DIVER Analytics, Filter Tool; State CAFRS; Lumesis Data Team
Now for some visuals and a bit of context. First, we take a look at the Funded Ratio by State. While we have collected data from 47 States, the below shows a few less. The reason (and to Mr. Malanga’s point) is data inconsistency or State’s failure to report the underlying data to allow for the necessary calculation. We all look forward to GASB implementation! An important factor to note is that while the majority of reporting States are funded at 75% or better, the Funded Ratio for 32 States is less in 2012 than it was in 2011 ! This is a fact despite the headlines of better investment results for plans.
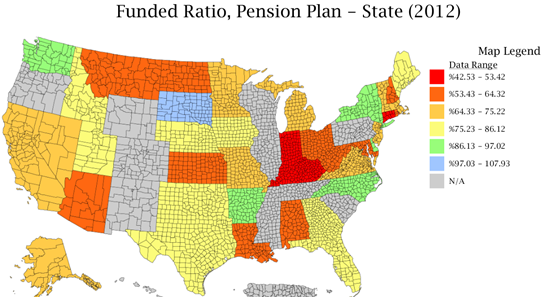
Source: DIVER Analytics, Map Module; State CAFRs.
ARC Paid is a bit better in terms of data availability and results – blue is 100% or better. 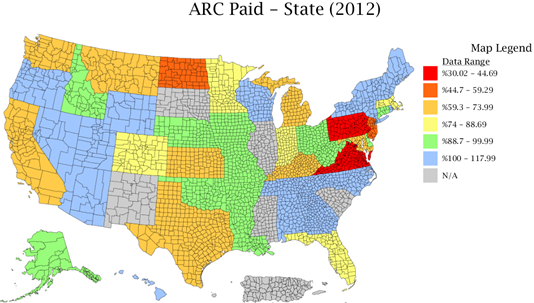
Source: DIVER Analytics, Map Module; State CAFRs.
As our regular readers know, access to timely data and knowing the details is what matters. In addition to the aggregate data made available in the DIVER platform, we are making available, in excel files, the underlying plan level data. This data provides 15 distinct data points for the Plans for every State (and Puerto Rico and DC) and cities with populations greater than 100,000. The data points include:
- Funded Ratio
- Discount Rate or Assumed Investment Return
- Percent of ARC Paid
- UAAL by Population
- Smoothing Method
If you are interested in learning more, please contact us at 203.276.6500.
Gregg L. Bienstock
CEO & Co-Founder, Lumesis, Inc.
This Week’s Data :
Food Stamp Change and Rank, State, March 2013
Delinquency Rate (Res. Mortgage), State, April 2013
Drought Intensity, County, 6/4/2013
GDP, GDP Growth, GDP Per Capita, GDP Per Capita as % of US, GDP Rank, State, 2012
Weekly Initial and Continued Jobless Claims, State, 5/25/2013
Exports Total (Monthly), State, April 2013
FEMA Disasters, County, May 2013
UPDATED: Bankruptcy Filings - Issuers, County, 2013
UPDATED: Default Filings - Issuers, County, 2013
UPDATED: Special Event: Tornadoes, County, 2013
© Lumesis


