Employment Data, State of the States and Interesting Quotes Worth Exploring
I simply can’t seem to shake the notion that some basic issues continue to exist despite some of the favorable headlines and discussions with some pretty smart people who think the worst is behind us (I do subscribe to the view that it is critical to seek out views contrary to my own to keep me in check). During these discussions or when revisiting their basis, I can’t help but revert back to the data. After all, facts are facts.
This week, we start with a look at the April Employment data. I then turn to offering a look into the recently released State of the States from Laffer Associates and a quick look at some Philly Fed data. I conclude with some thoughts from Doug Rudisch and a link to an excellent paper he has prepared. For the record, I had not heard of or read any of Doug’s work until about three weeks ago.
April Employment Data Sprinkled with Personal Income
A few weeks back, folks were feeling pretty good about job creation and, while not as robust as hoped, the view was positive. This week, the county level data for April was released and I can’t help but to continue to feel a bit uneasy. For the record, we focus on not seasonally adjusted data. The tables below slice and dice the data a number of ways to help spot trends. I think there is something here for everyone – glass half full and half empty. The distinction for our readers is what time frame drives the trend you believe most and what data combinations. Guess that’s why there are always buyers and sellers.
![]()
- Labor Force is down in 1,804 counties since April 2012
- Unemployment is equal to or greater than it was in April 2012 in 1,237 counties
- Labor Force is down in 1,522 counties since January 2013
- Unemployment is equal to or greater than it was in January 2013 in 72 counties
Source: DIVER Analytics, Filter Module; BLS.
Again, beauty (or lack thereof) is in the eye of the beholder.
Along the same paradigm, one may ask, “what does Job Growth look like over the past year?” Yellow, green and blue are positive (for the record, quite a bit of yellow is <1%). While the picture looks reasonably good, the details are important. Are these full-time or part-time and what do wages look like? See below for a bit more on income and quotes from Doug’s work.
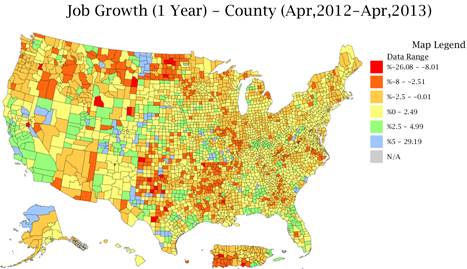
DIVER Analytics, Map Module; BLS
To add to my queasy feeling and perhaps provide some initial insight into the wages question, we offer a quote from the BEA’s Friday release regarding national level Personal Income data.
Personal income decreased $5.6 billion, or less than 0.1 percent, and disposable personal income (DPI) decreased $16.1 billion, or 0.1 percent, in April, according to the Bureau of Economic Analysis. Personal consumption expenditures (PCE) decreased $20.5 billion, or 0.2 percent. U.S. Bureau of Economic Analysis Release, May 31, 2013.
The short of it is that no one factor is the driving force and one must consider all of the data in concert and watch the trends.
Tax Policy and Its Impact
Several weeks back, there was an article in the Wall Street Journal that discussed tax increases for the State of Minnesota and what those tax increases might mean for the State. The article spurred me to look for an editorial written by Dr. Arthur Laffer for his view on the impact of tax increases and decreases. As I was doing so, I received an email that the sixth edition of Rich States, Poor States : ALEC-Laffer, was released. This publication, available via Laffer Associates, ranks US States on their relative competitiveness. In doing so, they look at a number of data points, many of which we track throughout the year for each State. According to Laffer’s “State of the States”, released May 23, 2013:
The evidence clearly shows that, as a group, states with pro-growth policies … are beating the high-tax … states in terms of all relevant performance metrics…
So you have Dr. Laffer’s view on tax policy. Not a surprise for those of you familiar with his work but his view is supported by data. Other supported views welcome.
Rich States, Poor States provide their Economic outlook for the States. Below, with the permission of Laffer Associates, we provide a view of the top and bottom five States as provided for in The State of the States, Laffer Associates, 5/23/13.

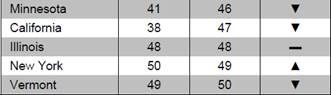
Many of the factors considered by Laffer Associates are updated regularly in the DIVER platform.
Below are a series of quotes from Doug Rudisch’s paper and a link to the educational, interesting and somewhat provocative (his admitted intent in writing it) “Why Policy Has Failed”. In the short space I have, I simply can’t do justice to his work but offer these tidbits to whet your appetite.
- What I can say with absolute certainty is that I have lost a lot of faith and trust in the system… This sentiment is running at all-time highs amongst business leaders (their collective in-actions prove it) and guys on the street. It is both sides of the barbell and middle that are upset. Often it’s one or the other, but not all three.
- If there is no faith in the system, it has a really hard time working. And I mean real underlying faith and trust in the system, as opposed to confidence borne from economic steroid injections or entitlements.
- … one would probably not think there would be an explosion of corporate profits under these conditions: When the stock market was at this price in 2007: Consumer Confidence: then 99.5, now 69.6; Americans on Food Stamps; then 26.9 million, now 47.69 million. Also real median annual household income (using what is an understated CPI in my opinion) in January of 2013 was $51,584 – or 92.7% of the level in January 2000 and it remains well below the $54,008 level seen at the start of the recovery in 2009.
- The costs and risks of monetary policy attempting to substitute for un-sound structural policy are much greater than the potential benefits! It just causes asset bubbles and does not drive employment. The cycle during the housing bubble was marked by tepid and disappointing employment gains. And this cycle, equity prices have ripped and housing prices rebounded, and again employment growth has been very disappointing.
Have a great week.
Gregg L. Bienstock
CEO & Co-Founder, Lumesis, Inc.
This Week’s Data :
- Drought Intensity, County, 5/28/2013
- Weekly Initial and Continued Jobless Claims, State, 5/18/2013
- UPDATED: Special Event: Tornadoes, County, 2013
- Unemployment and Unempl. Rank Change, April 2013, County
- Labor Force, County, April 2013
- Job Growth, County, April 2013
- UPDATED: Default Filings - Issuers, County, 2013
- Philly Fed Leading Index, April 2013, State
© Lumesis


