As our regular readers know, we have a level of concern with regard to the budget deficit, the debt ceiling and all things related thereto. And, while many of us have concerns regarding maintenance of the tax-exemption for muni debt and the tax-deductibility of muni fixed income interest, this week we are approaching the world from a slightly different angle. The focus: how reliant are States and counties on the Federal Government and who is most reliant.
You may be asking why I am still concerned given, on Tuesday, the CBO revised its deficit projection for 2014-2023 down by $618 billion to $6.3 trillion (revision since February). Not surprisingly, the NY Times (May 18), The Wall Street Journal (May 15) and Barron’s (amongst others) all had views on this with one suggesting “all is well.” The WSJ ran a headline, “Deficit is Shrinking Quickly”, 5/15/2013, A2, that didn’t tell the whole story but did note that the CBO’s change in its deficit projection for 2014-2023 also recognized that government borrowing is projected to start increasing in 2019 and remain over 70% of GDP (the prior 40 year average of debt to GDP – 39%). Barrons’ Gene Epstein was more direct noting:
“if the CBO updates are interpreted by Washington as an excuse to postpone painful budget cuts, it means only that the cuts will be all the more painful later.” Barron’s, U.S. Debt Pollyannas Due for Rude Awakening, 5/20/13.
Epstein then goes on to remind folks of a few important facts noted in the report:
- The “alternative fiscal scenario” projects debt as a share of nominal GDP to go to 83% by 2023
- The CBO report is keyed off some important assumptions—current laws remain unchanged, including
- Doctor’s fees under Medicare are cut (these cuts have not materialized for the past 10 years due to congressional override)
- Special tax provisions for lobbying groups that are routinely written into law with time limits (thereby reducing the longer term budget impact)
More updates are to come from the CBO. Epstein does a good job highlighting some of the reasons for my concern and then there is my skepticism that can be boiled down to a simple question: can the CBO change their projection the other way in 3, 6 or 9 months when tax receipts don’t continue at the current rate, Fannie and Freddie don’t deliver the same “dividend” or something else “unexpected” impacts the economy?
Before getting to how reliant are States and counties on the Federal Government and who is most reliant, there is one other matter to address. A good friend of mine suggested the “all is well” position and zeroed in on employment numbers. Over the past months, I have routinely suggested we look across data more broadly than the unemployment rate and initial jobless claims. This week, I will simply list a series of quotes to make the point.
- Average length of unemployment is 37 weeks (almost double what it has ever been)
- 90 million American adults now subsist outside the official labor force
- Workforce participation levels are the lowest they have been since the 1970s (see map below)
- Millions have been added to disability rolls (almost 2 million since the beginning of the Great Recession)
- Some find that in some States they can collect more on government assistance than they can earn by working lower-wage jobs
- Large number of those simply discouraged
Skills, Education and Employment, Thoughts from the Frontline, May 11, 2013, citing David Rosenberg.
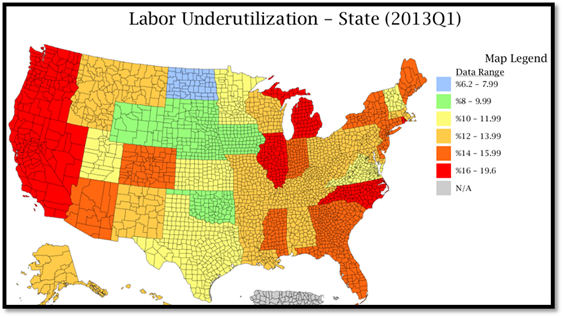
DIVER Analytics, Map Module, BLS.
As noted, I have spent time on this before and I continue to encourage you to look beyond the headlines.
Now to the main thrust of this week’s commentary. Sorry it took a while to get here but I thought a foundation was in order. As our subscriber s know, we have been tracking Federal dollars that make their way to the State and county level. The problem is that the source, the US Census Bureau, discontinued this data with fiscal 2010 year. No, not sequester – it was discontinued before that. Funny how it happens when the data is so important to a critical national debate.
Not only have we been able to find the data but the frequency with which the same will be updated is significantly better than anything the Census Bureau had provided. Before jumping in, a few fun questions for our readers (yes, send your responses – answers in next week’s commentary):
- How many Federal agencies are there?
- Can you name the top three agencies that contract, grant, insure, loan and otherwise pay (not counting covert money from agencies to Mr. Karzai or others) money to the States?
- Is there really a government agency called the Tricare Management Activity?
Some fun facts for you:
- Top 10 US government agencies dispense more than $2.6 trillion per year while the top 20 dispense $2.845 (seems we know where the focus on spending needs to be if that is the solution or part of it)
- Employment and Training, at over $9 billion, exceeds the amount spent by the CDC and FAA
Now to the crux of the point. There is a substantial amount of money making its way from the Federal government to State and local economies. The map below is a baseline of which States are most reliant on the Federal government. The map simply shows the aggregate federal expenditures and obligations received by each State and the constituent entities within each State, whether governmental units, private entities or individuals, for 2012. By the way, these numbers are expressed in thousands of dollars. Given the size of the numbers we’re discussing, it’s not hard to see how a reduction in spending by the Feds can have a significant impact on the economy of a State. Which State received $530 billion in 2012? Nope, not California…Florida.

DIVER Analytics, Map Module; USASpending.
If/when deficit reduction happens it will undoubtedly, irrespective of your political views, include tax increases and spending cuts and absolutely impact every State and municipality in some way. The map above is the starting point to beginning to understand how municipalities of interest to you will be impacted. In the coming weeks, we will offer a few more tidbits on this ever so critical topic.
Beginning this week, the DIVER platform will be incorporating critical Federal Funds contract, direct payment, grant, insurance, and loan information at the State and County levels and we will be expanding the same to include cities as well. This data will be updated monthly. Additionally, this data will be made available as a stand-alone data delivery option.
Last Week’s Data :
UPDATED: Muni Index, Point in Time and Trend, May 2013, State
Unemployment and Unempl. Rank Change, April 2013, State
Weekly Initial and Continued Jobless Claims, State, 5/4/2013
Drought Intensity, County, 5/14/2013
Food Stamp Change and Rank, State, February 2013
On the Road : Gregg and Debra will be in DC for the FINRA conference.
Gregg L. Bienstock
CEO & Co-Founder, Lumesis, Inc.
© Lumesis


