An old measure but a useful one. It should give us some indication of the market after the 23% gain in the S&P[1] since November. The measure is simple enough: the forward price earnings yield less the yield on the GT30. This makes sense because the duration of equities is around 16.5, which is close to the GT30 of 19. By the way, other sources, notably the New York Fed use different approaches, for example Cyclically Adjusted Price Earnings and a shorter duration risk-free rate. But it’s the vectors that matter not the scale.
Right now earnings estimates for the S&P are $122. The earnings yield is 7.3% and theERP4.2%. Last June it was around 5.3%. So it narrowed as investors priced in i) less uncertainty ii) QE running longer and iii) sustainable profits and margins. Another bullish line was that ERP since the 1970s had bounced between 1% and 7.7%, so stocks were cheap. The problem is that the mean we’re looking to revert to is all over the place. Since 2008, it has been 3.8%. Since 2002, 2.5%. But, whoops, closer to 10% in the 1950s and negative in the 1990s. Pick your period for how cheap or expensive you think the market.
We would caution: never use one metric. The issues we’re facing today are: i) a highly managed yield curve, similar to the 1950s when the Fed held a 2.5% peg to finance war loans (so if yields were at normal levels -- yes, this is a counterfactual -- the ERP would be negative), ii) slowing earnings growth, iii) sales growth at around 2%, and finally iv) GT10s reversing their recent “growth is picking up” trend, which accounted for the 1.65% to 1.95% move in May, to “growth is moderating,” as a bunch of indicators last week suggested. In that case, bonds could rally 20bps and the ERP reverse back to the 4% to 5% range.
So the ERP is not telling us too much. Which means we’re back to individual stories to make the case for equities.
The Vanishing Debt
The Fed has misread the economy several times over the last few years. Back in 2011, it assumed that we would now have 4% growth, 7% unemployment and 2% inflation, all of which we’ve missed by yards. No matter. The Fed adjusted policies quickly and didn’t tighten too soon.
Over at theCBO, the forecast errors were larger. In March, the estimates were for a $845bn deficit. But after a record $113bn surplus in April, a 20% increase in tax receipts, and a 9% cut in discretionary spending outside of the Big 5 (so that’s Social Security, Medicare, Medicaid, Defense and Interest), the new projected deficit is $642bn or 4% of GDP. Down from 10.1% in 2009. So the quickest way to improve deficits, is, it turns out, not spending cuts, sequesters and austerity but, well…getting people back to work. Who would have thought?
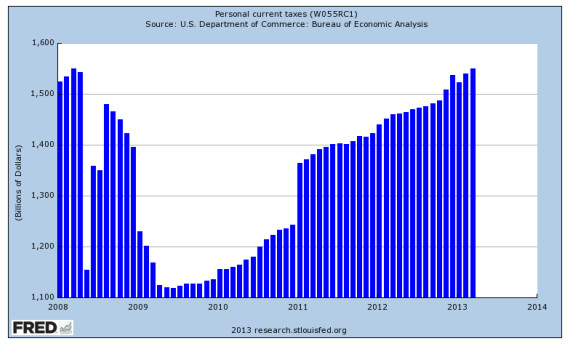
Source: Federal Reserve Bank of St. Louis, Economic Research
Sources: Bloomberg; Barclays; Capital Economics; Federal Reserve Bank of St. Louis; Trend Macro; Congressional Budget Office; Factset; Federal Reserve Board; JP Morgan; “Implied Equity Duration: A New Measure of Equity Risk,” Patricia M. Dechow, Richard G. Sloan, and Mark T. Soliman; Liberty Street Economics; Federal Reserve Bank of New York; US Department of the Treasury; Sentinel Asset Management, Inc.
[1] Standard & Poor's 500 Index is an unmanaged index of 500 widely held US equity securities chosen for market size, liquidity, and industry group representation. An investment cannot be made directly in an index.
© Sentinel Investments
http://www.sentinelinvestments.com


