This week, we take a look at Job Growth, Exports and look at Housing from a different angle. We conclude with a great quote and an introduction to a comprehensive resource for information and data around bankruptcies and defaults.
If there is one message I have routinely tried to drive home it is to look beyond the headlines and understand the details. This past week, several of us attended the NFMA’s annual conference and, amongst the many excellent presentations, it was reassuring to see the esteemed presenters implicitly (and in some cases explicitly) espousing the same message (make no mistake, many have been doing so long before I jumped on the bandwagon).
That said, headlines move markets. Friday’s jobs numbers had a significant impact on US markets and was considered a positive surprise as far as expected job growth. A few things to consider: First off, in the past, we (and many others) have written about the shallowness of the Employment Situation Report (relative size of the survey group) and encourage you to keep in mind what the report is and isn’t. Next, while the stated addition of 165,000 jobs for April is good, consider the veracity of the number. March employment growth, from the survey, was revised upward to 138,000 from the original projection of 88,000 – for those keeping score, about 57% different than the original number. Even the weather people are better than that! Finally, if we continue at the average pace of job growth this year, it will take 5 more years to return to pre-recession unemployment of 5%.
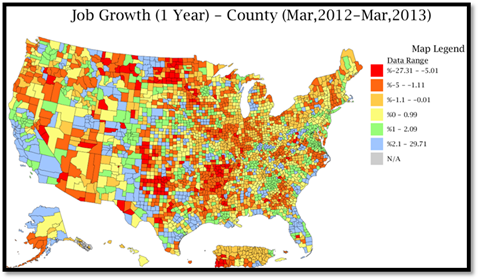
Job Growth and U-6
Below we look at Job Growth from the State and county level. Our data is for March and represents the latest detailed figures from the BLS. The important point for our readers -- it is a big country and one needs to understand where the growth is and is not.

DIVER Analytics, Map Module; BLS
DIVER Analytics, Map Module; BLS
One or two more important points before I move on. U-6, Labor Underutilization, is another factor where we have historically directed our readers.
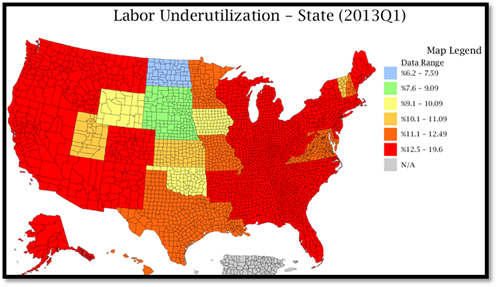
DIVER Analytics, Map Module; BLS
Only six States have a Labor Underutilization rate of less than 10%. That said, a full 44 States have a lower U-6 than one year earlier. A glass half full, if you will. Other factors we encourage our readers to explore include the number of employed people and the labor force. Additionally, we strongly encourage our readers to explore wage and income data – Average Weekly Wages, Personal Income and the like (hint – for the latest on Average Weekly Wages, only six States exceed where they were a year prior). The devil or angel is in the details.
Exports – They Matter
Looking beyond our borders, we all know that the EU is not exactly a bastion of economic growth. In the past, I have suggested our readers contemplate the impact of the EU recession on our economy. Think exports, jobs and, of course, tax receipts resulting therefrom. For 2012, Export Growth averaged 4.25%, however, when we look more closely at the data, we see that only 18 States have experienced growth in Exports over the one year period ending March 2013. We encourage our readers and subscribers to ensure they are aware of who the trading partners are and how the economic climate abroad can impact States and localities where you have holdings.
Housing – Something More than Foreclosure
Often times, the headlines speak to foreclosures and house prices on a regional basis. Another barometer to consider is the Homeownership Rate (homes owned divided by the number of households). Looking at the first quarter 2013 numbers, only four States can claim their Homeownership Rates are equal to or better than they were at the end of 2008. Similar to the jobs numbers, we have a ways to go to get back to pre-recession levels. On a more positive note, looking back one year, 24 States have seen growth in this important data point and the green and blue below show where the rate exceeds 68%.

DIVER Analytics, Map Module; US Census Bureau
A Closing Quote
Regarding the US equity and fixed income markets:
We all know that markets don’t always reflect the health of the economy. It is not unusual to experience stellar market returns in an otherwise mediocre economic backdrop …
Sheraz Mia, Director of Research, Zacks Investment Research.
Bankruptcy Data and This Week’s Data Release
We are pleased to let you know that the DIVER database now includes comprehensive information on State Authorization for Chapter 9 Bankruptcy. Our data delivery provides the ability to map the data in six simple to understand segments (you can also use the Filter, Data Access and PSC Modules). We also provide our subscribers a detailed guide that sets forth the specific State law citations. This release complements our recently released Bankruptcy and Default Data and Detail (which is updated weekly) creating a truly comprehensive perspective around bankruptcy law and activity.
Last Week’s Data – there was quite a bit :
Exports Total (Monthly), State, March 2013
Drought Intensity, County, 4/30/2013
Weekly Initial and Continued Jobless Claims, State, 4/20/2013
Job Growth, County, March 2013
FEMA Disasters, County, April 2013
NEW: Authorization For Chapter 9 Bankruptcy, State, 2013
Unemployment and Unempl. Rank Change, March 2013, County
Labor Force, County, March 2012
Muni Index, Pt. in Time/Trend, County, May 2013
Philly Fed Leading Index, March 2013, State
Homeownership Rate and Homeowner Vacancy Rate, State, 2013 Q1
UPDATED: Default Filings - Issuers, County, 2013
On the Road : Mike and Ralph will be in Las Vegas at the NAPFA conference. Gregg and Tim will be at the Children’s Village Annual Gala Thursday evening (www.chlidrensvilalge.org) – CV is a wonderful organization. Finally, Gregg and Debra will be in NYC on Friday for the MAGNY lunch along with a few other stops.
© Lumesis


