Markets Rise Despite Economic Data
Equity markets rebounded from their worst weekly loss of 2013, despite a mostly negative week of economic data. The S&P 500 rose 1.8%, while the Dow Jones Industrial Average climbed 1.2%.
Equity gains were driven, in part, by corporate earnings. Following last week when approximately 25% of the S&P 500 index reported, the benchmark’s blended earnings growth rate increased from 0.1% to 2.1% for the quarter. Market participants appeared to ignore continued deterioration in revenues, however, as is clearly illustrated in the chart below from FactSet. Top line growth has contracted 0.6% thus far in the quarter, and just 44% of companies have reported revenues above consensus.
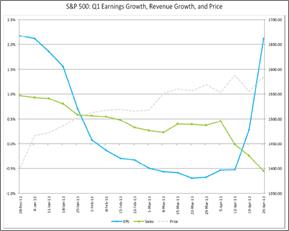
Source: FactSet
Markets also ignored a mini repeat of May 2010’s flash crash last week. A fraudulent tweet from the Associated Press on Tuesday, which reportedly had its Twitter account hacked, reported explosions at the White House that had injured President Obama.
The Dow shed over 140 points within three minutes, but subsequently rebounded after the reports were deemed erroneous. The event served to remind investors of the impact of high frequency traders in the marketplace, renewing the debate about the lack of regulation of the industry.
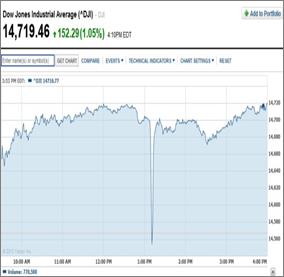
Source: Google Finance
Of the four marquee economic indicators released last week, each missed consensus expectations. This was led by the initial estimate of first quarter GDP, which came in 0.6% below forecasts. Although consumption continued to be a component of strength in the report, the ongoing contraction in government spending is sapping demand.
The 2.5% seasonally adjusted annual rate (SAAR) of GDP growth in Q1 was certainly a step up from the fourth quarter’s paltry 0.4% figure. Unfortunately, a big component of the quarter’s increase was driven by inventory investment. This is seen as an unsustainable driver of future economic growth, leaving many to question the fragility of the US’ current expansion.
On the housing front, both existing and new home sales came in somewhat soft in March. This is being partially driven by a lack of supply, however, mitigating concerns in some corners. The ongoing surge in housing starts may serve to alleviate the issue in the months ahead.
Existing home sales slowed by 0.6% in the month, falling to a SAAR of 4.92 million. Total supply edged up to 4.7 months, which represents a 16% fall in total inventory from 12 months ago. A decline in the level of distressed transactions – now down to 21% - may be contributing to this trend. This is leading to higher housing prices, however, which are 11.8% higher than March 2012.
New home sales did increase from the month prior, but only marginally so and below expectations. The SAAR of 417,000 home sales is facing the same set of headwinds as existing home sales – namely, tight supply. The stock of new homes remained unchanged in March at 4.4 months, levels last seen in the build up to the housing bubble. Unlike the existing home series, however, new home sales experienced a price decrease of 6.8% month-over-month. Over the past 12 months, prices are 3.0% higher.
Lastly, durable goods exhibited a steep contraction in March of 5.7%, compared to an expected 2.8% decline. While the series is notoriously volatile, economists are troubled by a material drop in the core portion of this series of approximately 1.4%. Weakness was observed broadly across the various industry components, including primary and fabricated metals, machinery, electrical equipment, and other durables. The report gives credence to the three-point fall in the ISM manufacturing index released in early April, and increases concerns about the health of the US manufacturing sector moving forward.
Is May Really The Time To Go Away?
As investors near the witching hour of May, the oft-asked question once again comes to the foreground – is it best to sell in May and walk away? This year could prove the exception to recent history, but a number of trends are beginning to take shape inside the market’s inner workings.
A common adage among investors is “sell in May and go away,” returning only at the start of November. CXO Advisory recently analyzed that phenomenon and determined a basic buy and hold strategy actually worked to investors’ advantage relative to moving in and out of the market based on seasonal patterns.
Source: CXO Advisory
Nevertheless, investors have an affinity for such behavioral beliefs and there may be reason to believe the sell in May strategy works on certain areas. Thomson Reuters looked at performance for each of the S&P sectors and found that economically sensitive sectors such as consumer discretionary, industrials, and tech generated a loss, on average, during the May to November period since 2000. Defensive sectors such as utilities, consumer staples, and healthcare were the biggest winners.
Source: Thomson Reuters
Is it possible that same trend could play out in 2013? Perhaps, but not likely. From the start of the year through April 26, the top performing sectors this year were healthcare, utilities, and consumer staples. Higher dividends make those sectors inherently more attractive in this environment, but they are also becoming the most expensive sectors based on price/earnings metrics. In addition, during the current quarterly earnings season, Horan Advisors pointed out that the lowest earnings growth is occurring in, unsurprisingly, consumer staples, energy, healthcare, and utilities.
Source: Sober Look
An interesting trend among those outperforming sectors is the reliance on domestic revenue sources. According to Bespoke Investment Group, out of the top four performing sectors this year, utilities and telecom derive more than 90% of their revenue from the U.S., while healthcare and consumer staples are closer to the 65% range.
Source: Bespoke Investment Group
Indeed, research from Bank Credit Analyst (BCA) surmises that a mix of “profit, valuation and macro considerations” is leaning towards a cyclically oriented portfolio, as opposed to one more defensive in nature.
Source: BCA Research
From an aggregate valuation standpoint, stocks do not look terribly overvalued, despite what could be a temporary seasonal setback. Thomson Reuters shows the current P/E at 13.5 on a 12-month forward basis, slightly above the 5-year median of 12.7, but below the long-term median of 15.
Source: Thomson Reuters
What happens to equities over the summer season is a guessing game, but Goldman Sachs made headlines last week when it came out and upgraded equities from neutral to overweight for the next three months, targeting a 4% return. That may be the clearest sign yet that now is the time to sell stocks, as such public proclamations rarely end well.
The Week Ahead
Earnings take a back seat to economic data this week, with personal spending data, the twin ISM reports, and the government jobs report taking center stage. The Federal Reserve also meets on Tuesday and Wednesday to discuss monetary policy.
Earnings season continues with major reports due from Boeing, Volkswagen, BP, UBS, Anheuser Busch-InBev, Pfizer, MasterCard, Royal Dutch Shell, Sanofi, Kellogg, and BNP Paribas.
Aside from the Fed, global central banks including the ECB, Romania, Czech Republic, and India are scheduled to meet. Consensus expects the ECB to cut its policy benchmark rate by 25 bps.
About Fortigent
Fortigent, LLC delivers a fully integrated and customizable business-to-business outsourced wealth management solution to banks, trust companies, and independent advisory firms. Services include a comprehensive investment platform with particular expertise in alternative investments, a flexible unified managed account program, and consolidated wealth reporting. Fortigent's web-based portal interface allows access to proposal and rebalancing tools, client portfolio reporting and accounting, as well as industry articles, research papers, and other practice management and business development resources.
For more information, please visit our website at http://www.Fortigent.com.
The information provided is general in nature and is not intended to be, and should not be construed as, investment, legal or tax advice. Fortigent makes no warranties with regard to the information or results obtained by its use and disclaims any liability arising out of your use of, or reliance on, the information. The information is subject to change and, although based upon information that Fortigent considers reliable, is not guaranteed as to accuracy or completeness.
Not FDIC Insured No Bank Guarantee May Lose Value
© Fortigent