Spring is in the air and it has nothing to do with the lovely weather we are experiencing here on the east coast. Congress – both houses – have done something for the American public. FAA, sequester, flight delays – we can fix that! While I would usually take a cynical swipe at Congress (something like, “did they act because they, too, were impacted by their own stubbornness”), I’ll let well enough alone and simply pass on a heartfelt thanks. Perhaps this is the start of something. I hear they are working closely on immigration reform and an exemption for Congress and their staff from the Affordable Care Act (aka Obamacare). Ok, so two of three initiatives garnering bi-partisan support are purely self-serving. I couldn’t resist.
Now to this week’s commentary. In keeping with the Spring theme and the glass half full approach (I’ve been accused of not always having that perspective), we start with a look at the seemingly good news on the jobs front and do our level best to poke some holes in the data. We look briefly at data around the budgets floating around DC and what the same may mean for the municipal market. We close with an update about a new feature to Advisor (thanks to TM for an awesome idea).
This week’s Weekly Initial Jobless Claims were trumpeted as being the lowest in years. We took a quick sampling of some recent data around Continuing Jobless Claims, also reported weekly, and found some encouraging news. The US and every State, yes every State, saw a decline in the number of Continuing Jobless Claims. We focused on the period beginning January 26 through April 13 (the data released this past Thursday) to see if it was less than the highest number of continuing claims during our sample period. Below are the five biggest declines from the highest to the most recent.
|
Idaho |
-35.98% |
|
South Dakota |
-33.13% |
|
Wyoming |
-31.80% |
|
Nebraska |
-31.01% |
|
Montana |
-29.26% |
Source: DIVER Analytics, Data Access Module; US Department of Labor.
Never one to leave well-enough alone, I also took a look at the Labor Force data for the period of January through March (the overlap period) to see if the decline in Continuing Jobless Claims was supported by increased Employment and Labor Force or not.
The news, at least for this finite period, is reasonably good. The number of people Employed is up in 45 States and, if we refine that group to include only those States where the Labor Force grew, we are left with a solid 24 States. Of this group of 24, the top five States for percentage growth in the number of people Employed :
|
Alabama |
2.29% |
|
Washington |
2.24% |
|
Iowa |
2.18% |
|
South Dakota |
2.18% |
|
Michigan |
1.52% |
Source: DIVER Analytics, Filter Module; BLS.
For the doubters, which usually includes yours truly, I expanded my timeframe and looked at Job Growth and was, for the most part, pleasantly surprised. Yellow, green and blue are greater than zero. Glass half full.

Source: DIVER Analytics, Map Module; BLS.
And Personal Income Change for the period 2011 to 2012 also shows positive for all but South Dakota (surprisingly) but that is down less than 1%.
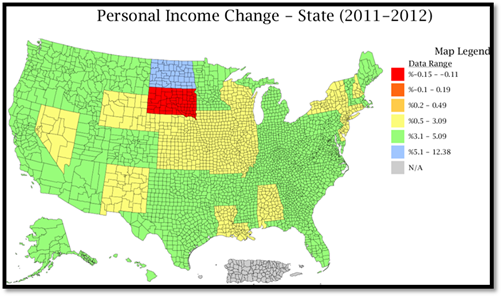
Source: DIVER Analytics, Map Module; BEA.
While not robust, they do support some level of growth. The reality, however, is much more growth is needed on both the jobs and income fronts. Still half full.
Returning to earlier comments about harmony in DC, we turn to what is being said about the three budgets presented by our government. Let’s start with, “all three proposals assume away the real world” and that “they all lack the basic precautions … that those of us involved with preparing family and business budgets make sure to include in our own forecasts.” Assume a Perfect World, John Mauldin. Some examples courtesy of the aforementioned:
- Last year, real inflation-adjusted GDP growth was 1.7% and nominal growth was 3.5%, the lowest since the end of WWII.
- The White House budget predicts 3.6% growth by 2016 and tax revenues up by 50% (Mauldin citing the WSJ) while interest rates remain low – only 1.2% in 2016 and inflation of 2.2%. Sign me up!
- CBO projects 2013 growth of only 1.4% and then to 4.2% (3x) over the next three years; it does not project interest rates consistent with the White House budget (north of 3% in 2016 for the 10 year).
As you all know, how to solve the budget mess is subject to differing approaches. The point is less about who to believe and more about how one can realistically attempt to address our nation’s budget issues and tax reform when one assumes a perfect world? Thus, while we may be spared some of the pain, we should understand the context in which these changes will be made.
Politics aside, interesting quotes (context: discussing Europe – feel free to substitute for the referenced geography) and something further to contemplate.
“Austerity” is now the name we give to the situation where a government has to limit its spending during an economic downturn or recession… Austerity is a consequence, not a punishment. A country loses access to cheap borrowed money as a consequence of running up too much debt… Austerity is a result of a country’s trying to entice lenders into believing that the country will change and make an effort to restore confidence.
[Referring to the US economy] We squandered our surplus with new programs and spending. We borrowed and consumed. We wasted the good times by running up even more debt. Austerity is a Consequence, not a Punishment. Thoughts from the Frontline.
This brings me to our market – municipalities of all shapes and sizes. As we have noted in the past, many municipalities have taken significant steps to manage today’s fiscal reality and what may come tomorrow. Indeed, some even use realistic budget assumptions and others have replenished or maintained their Stabilization Funds. Many use 5% as an ideal level for such funds, yellow, green and blue meet the threshold.

Source: DIVER Analytics, Map Module; NASBO.
As tax reform, budget resolutions and the reality of tax-exemption come into focus, we have to wonder how municipalities, who rely on tax-exemption and support from the Federal government and States, will fare when all is said and done. How much more can be passed on to be assumed by the States?
A closing note. DIVER Advisor now has a proprietary Credit Note Dissemination Module. This allows client firms to efficiently disseminate, to all internal users, credit notes associated with any bond, issuer or location and set expirations.
On the Road : Mike and Ralph will be in Denver for the NAAIM conference and New Orleans for the IAA conference. Gregg, Tim and Debra will be in sunny San Diego at the NFMA’s annual conference. Please stop by and say hello.
Have a great week.
Gregg L. Bienstock
CEO & Co-Founder, Lumesis, Inc.
This Week’s Data :
- Labor Underutilization, State, 2013 Q1
- Weekly Initial and Continued Jobless Claims, State, 4/13/2013
- Drought Intensity, County
- Coincident Index Change, March 2013, State
- UPDATED: Default Filings - Issuers, County, 2013
© Lumesis


