This week we focus on Federal Funds delivered to the States and consider some interesting data points to contemplate as folks pretend to get a bit more serious about addressing fiscal issues at the National level. We move on to an interesting and surprising quote on rates and then a look at some facts and figures around bankruptcies and defaults.
Before starting, our thoughts and prayers go out to our friends in Boston and those impacted by the events of last Monday.
Federal Funds to the States
As we consider the possibilities associated with the debt ceiling, the budget and tax reform, we thought it was time to revisit a topic we explored months back. We start with a look at what the States receive from the Federal Government – for the data range, add three zeros. These are strictly absolute dollars. A starting point.

DIVER Analytics, Map Module; NASBO .
Now that we have a baseline, let’ s take a closer look at the details. It does, after all, seem unfair to call-out the more populous States by simply looking at raw dollars received. Let’s refine the above to look at Federal Funds Received as a Percentage of the State’s Revenue.
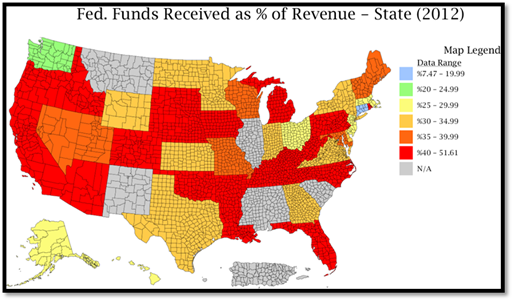
DIVER Analytics, Map Module; State CAFRs, NASBO, Recovery Act Transparency Board.
For purposes of our map, States in red – there are 19 of them – receive at least 40% of their revenue from Federal sources. DC comes in the lowest, at 7.47% (kind of makes you feel good) with Connecticut at 12.15%. So, while Connecticut does not fare all that well in our Muni Index (see page 3), they may fare better than other States should there be cuts in the amount of Federal Funds being doled out to the States. We will continue to track this data within DIVER at the broader levels and by spending category. Should Washington get serious about the debt ceiling, the budget and tax reform, Federal Funds received as a percentage of revenue will prove meaningful.
Interest Rates
Over the past year or so, I have spent time on the subject of QE 3 (or whatever we are up to) and expressed concerns about what happens when the Fed begins tightening monetary policy. This week I happened upon an interesting read by Michael B. O’Higgins (courtesy of Mark Faber’s Gloom, Boom and Doom Report) and learned that this is not the US’ first time with a period of extended low interest rates. O’Higgins notes that only 5% of respondents to a Merrill Lynch Fund Manager Survey believed that long-term US T-Bond rates would go lower in 2013. While not terribly surprising, reality has trumped this survey prediction. Here is the interesting part. O’Higgins points out that the Fed “kept long rates below 3% for 22 years from 1934 to 1956” and that Japan followed suit for 17 years and counting . The Rebirth of Equities, or 1966-82 Redux? O’Higgins. While the world has changed quite a bit since the ‘50s, market characteristics of our first encounter with Fed-induced low rates may prove educational. I know you can draw distinctions but it is another point of context to consider as we continue through what many characterize as “unprecedented times.”
Bankruptcies and Defaults
Recently we added data to our DIVER database regarding Bankruptcy and Default filings for 2011 to date. Our research was driven by user requests and our curiosity as to why published figures from various sources can be inconsistent. First and foremost, before facts and figures, our definitions are below to avoid confusion as to what we are covering.
- Default Filings- the number of unique issuers that submitted a Principal and/or Interest Payment delinquency filing with the Municipal Securities Rulemaking Board (MSRB) during the reference year.
- Bankruptcy Filings - the number of unique issuers that submitted a Bankruptcy, Insolvency, Receivership, or similar event filing with the MSRB during the reference year.
For each category, we do not remove the issuer from the filing category if they subsequently cured their “issue.”
|
Bankruptcies |
Defaults |
|
|
2013 YTD* |
11 |
47 |
|
2012 |
69 |
150 |
|
2011 |
45 |
162 |
*2013 is through 4/11/2013
If you are interested in obtaining the detailed data (by issuer), please let us know. We will continue to update this information weekly in the DIVER platform and for data only subscribers.
The DIVER Muni Index

DIVER Analytics, Map Module; Lumesis.
This week, a look at the DIVER Muni Index at the State level showing the year on year trend. The lower the number (lighter the color on the map) the better.
On the Road : Look for us at this week’s Bond Buyer Tri-State Conference in New York City. Gregg will be in Philly on Wednesday and in Boston, with Debra, on Thursday.
Have a great week.
Gregg L. Bienstock
CEO& Co-Founder, Lumesis, Inc.
This Week’s Data :
- NEW: Assessed Values - Total Per Capita, County, 2012, 2011, 2010, 2009, 2008
- UPDATED: Default Filings - Issuers, County, 2013
- UPDATED: Muni Index, Point in Time and Trend, April 2013, State
- Unemployment and Unempl. Rank Change, March 2013, State
- Drought Intensity, County, 4/16/2013
- Weekly Initial and Continued Jobless Claims, State, 4/06/2013
© Lumesis


