I was honored to be in St. Paul’s Cathedral attending Margaret Thatcher’s funeral this week. It was quite a special opportunity to pay tribute to Britain’s longest-serving prime minister in person, and the ceremony provided a reflective occasion on her influential leadership and unwavering conviction.
|
|

As her country faced an economic crisis with high inflation, high tax rates and hundreds of mining strikes, the lady’s iron courage helped her make the difficult decisions that steered the United Kingdom to a more sustainable path.
A steely resolve seems to be lacking in many of our world leaders today. Maggie led the U.K. down the path of privatization, encouraging entrepreneurship and free markets because her belief was that “Socialist governments traditionally do make a financial mess. They always run out of other people’s money.”
In his recent webcast, Global Portfolio Strategist Don Coxe points out the effectiveness of this privatization path, showing the rise in the U.K.’s real GDP from the time she was elected Leader of the Opposition in 1975 through today.
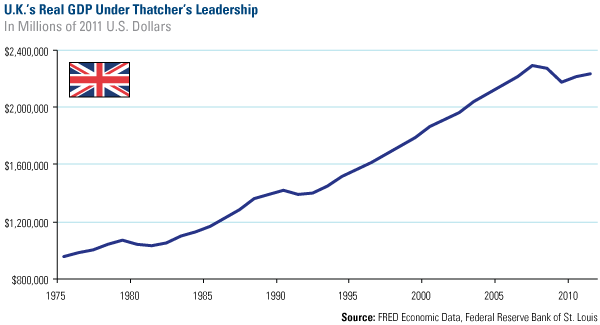
click to enlarge
Buyers Move from Gold ETFs to Physical Gold
After spending a few short days in London, I flew back to the U.S., landing in New York City to work with the International Crisis Group. U.S. Global Investors has been a strong supporter of the ICG, which works to resolve conflicts around the world and promote peace and prosperity.
I also met with several business leaders while in The Big Apple. For those of us in the investment business, we all have the same question on our minds: What’s going on with gold? How can governments’ balances sheets continue to expand like we’ve never seen before in history, yet the price of the metal melt so quickly?
We noted numerous reports indicating that there’s a shift taking place in the gold market, with investors discarding the gold ETF, preferring physical gold instead. Take a look at Zero Hedge’s chart. On one day alone, April 17, buyers scooped up a record 63,500 ounces from the U.S. Mint. This is equivalent to 2 tons of gold, “more than the previous two months combined,” according to Zero Hedge. This is a drastic move compared to recent history.
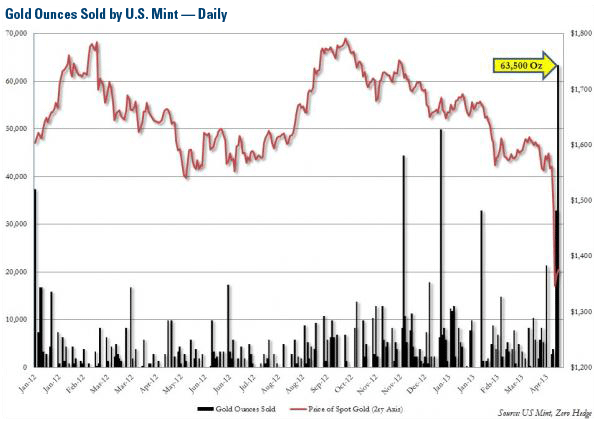
The U.S. Mint is generally the last place gold shoppers buy their ounces because they have to pay “a hefty premium” for gold. It’s like going to 7-Eleven on Christmas to buy AA batteries for the electronic toy Santa left under the tree.
However, gold shops such as Apmex or Gainesville Coins aren’t closed; rather, gold customers end up buying from the U.S. Mint because “nobody else has any physical [gold] at a lower premium to spot (or any metal in inventory),” says Zero Hedge.
So, even with the gold price dropping, why are gold coins selling at a premium? It’s Economics 101: The coin supply is limited and the demand is high.
|
|

This buying trend isn’t only occurring in the U.S. In Bangkok, Thailand, for example, crowds of buyers were filling stores, eagerly waiting in multiple lines to purchase gold jewelry and coins. According to The Wall Street Journal, “Gold shops from Tokyo to Dubai have witnessed frantic buying of the coins, alongside other items such as gold wedding bracelets. The surge has been triggered by cheaper prices.”
China Daily reported a similar buying enthusiasm occurring in jewelry stores in Beijing, Shanghai and Guangzhou. Shanghai’s newspaper reported that “while gold markets in the United States and Europe saw panic selling, sales of gold bars and jewelry jumped in China as buyers viewed the lower prices as an opportune moment to invest.”
To put it simply, for retail investors in the west and east, gold went on sale. A Black Friday special for the yellow metal in spring.
Moderation is Gold Investors’ Guide
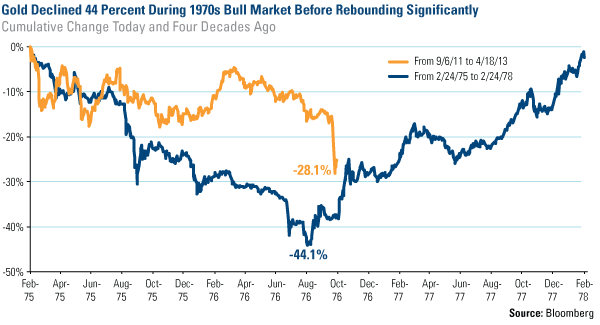
We believe the yellow metal is experiencing a short-term correction during its long-term secular bull market. Compare today’s gold bull run to the spectacular gold bull market in the 1970s. From February 1975 to August 1976, gold fell 44 percent. However, those investors who held tight to their gold were rewarded: From August 1976 to January 1980, gold rose an astounding 700 percent.
This time around, gold fell 28 percent over nearly the same period.
click to enlarge
This chart holds a mixed message for investors. On the one hand, if history repeats itself, gold could fall as far at $1,050. The positive message, though, is that history teaches us that gold can withstand a 44 percent decline and rebound substantially.
As Roman philosopher, Marcus Tullius Cicero, wisely said, “Never go to excess, but let moderation be your guide.” Cicero’s advice applies to life as well as when investing in gold. What I wrote in The Goldwatcher back in 2008 remains valid today:
“We put a lot of messages into the marketplace, but the one we stress most when it comes to gold is moderation. Don’t try to get rich with gold because the corresponding risk is simply too high. Gold is a volatile asset whose daily price action can be far more dramatic than blue-chip stocks and many other asset classes.”
Also Read: Four Important Facts to Remember About Gold
Index Summary
- The major market indices moved lower this week. The Dow Jones Industrial Average dropped 2.14 percent. The S&P 500 Stock Index fell 2.11 percent, while the Nasdaq Composite declined 2.70 percent. The Russell 2000 small capitalization index fell 3.22 percent this week.
- The Hang Seng Composite Index fell 0.29 percent; Taiwan rose 1.40 percent while the KOSPI declined 0.91 percent.
- The 10-year Treasury bond yield fell two basis points this week, to 1.70 percent.
Domestic Equity Market
The S&P 500 suffered its worst losses of the year, falling by more than 2 percent this week. A combination of factors was the likely culprit. Chinese GDP growth disappointed in the first quarter, with investors remaining skeptical that China will be able to grow as fast as expected for 2013 with a relatively slow start to the year. Gold sold off sharply on Monday after a big drop on Friday in what appeared to be a market dislocation that was difficult for even seasoned investors in the space to explain. This sharp selloff in gold spilled over to other markets as investors feared it was a precursor to financial market volatility to come. Defensive groups outperformed, while more cyclical areas were hit the hardest.
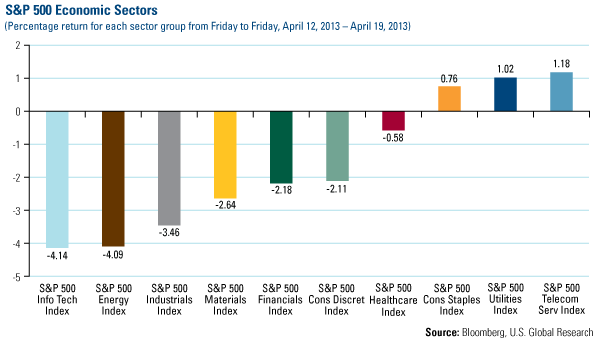
click to enlarge
Strengths
- The telecommunication services sector was the leader this week as Sprint Nextel rose by more than 15 percent on a takeout offer from Dish Network.
- The utility sector also outperformed as investors appreciated the stability and dividends that utilities offer.
- Sprint Nextel was the best performer this week as discussed above but Life Technologies rose by more than 8 percent on a takeout offer from Thermo Fisher Scientific.
Weaknesses
- The technology sector was the worst performer this week as bellwether technology names such as IBM, eBay and Apple were all down at least 8 percent. IBM and eBay were hit by disappointing earnings reports, while Apple was down on uncertainty over the timing of new product launches and fears of delays.
- The energy sector fell by more than 4 percent as oil was down by nearly as much. The sector was lower on macroeconomic growth fears. Bellwether energy names such as Halliburton, EOG Resources and Apache were all down more than 8 percent.
- Textron was the worst performer in the S&P 500 this week, declining 11.6 percent as the company missed first quarter earnings expectations and lowered its full year earnings forecast on weaker-than-expected business jet demand.
Opportunity
- The market is climbing that proverbial wall of worry and just shakes off any bad news.
- Global central banks are literally pulling out all the stops in an attempt to ignite economic growth.
Threat
- A market consolidation wouldn’t be a surprise after a strong start to the year.
- We are in the middle of earnings reporting season and the initial reaction hasn’t been good. Key names to watch next week are Caterpillar and 3M which should provide good color on global economic activity, while Apple, Starbucks and Amazon will give insights into recent consumer behavior.
The Economy and Bond Market
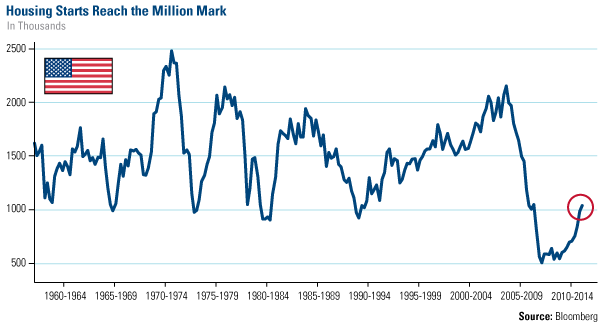
Treasury yields were little changed again this week as U.S. economic data was generally in line with expectations, while Chinese GDP data was weaker than expected. As can be seen in the chart, housing starts have breached the psychologically important 1 million units (annualized data) in March. This is one more data point to support the idea that the housing recovery is for real.
click to enlarge
Strengths
- Housing starts hit the highest level since 2008.
- Industrial production in March rose 0.4 percent, which was ahead of expectations. Cold weather was a driver as utility output rose.
- The consumer price index in March fell 0.2 percent. Year-over-year inflation has fallen to 1.5 percent, giving the Federal Reserve plenty of room to maneuver monetary policy.
Weaknesses
- Chinese GDP slowed to 7.7 percent in the first quarter, below expectations for an 8 percent increase. This definitely was the biggest economic story of the week and it appears the government is comfortable not taking any action.
- The Conference Board’s leading index unexpectedly fell in March. Economic data has been weaker lately and this leading indicator reinforces that idea.
- Brazil raised interest rates by 25 basis points this week. Brazil was one of the first to cut rates back in 2011 and this may be an early warning signal to other emerging markets.
Opportunity
- The Fed continues to remain committed to an extremely accommodative policy.
- Key global central bankers, such as the European Central Bank (ECB), Bank of England and the Bank of Japan, are still in easing mode. The Bank of Japan in particular is aggressively easing.
Threat
- Inflation in some corners of the globe is getting the attention of policymakers and may be an early indicator for the rest of the world.
- Trade and/or currency “wars” cannot be ruled out which may cause unintended consequences and volatility in the financial markets.
Gold Market
For the week, spot gold closed at $1,403.75, down $79.25 per ounce, or 4.02 percent. Gold stocks, as measured by the NYSE Arca Gold Miners Index, fell 11.30 percent. The U.S. Trade-Weighted Dollar Index rose 0.56 percent for the week.
Strengths
- You were wrong if you thought the drop in gold prices reflected lower consumer demand. The fact is the U.S. Mint’s sales of gold coins soared this week following the price plunge. On Thursday, the Mint reported sales of 153,000 ounces of gold coins, the highest in nearly three years, twice as much as sold in March, and seven times the volume sold this same week last year.
- The price drop also provoked clamor in the love trade countries. In the Zaveri Bazaar in Mumbai, India’s largest bullion market, demand in recent days was the most this year according to the All India Gems & Jewellery Trade Federation. Further east, Hong Kong and Macau gold merchants saw a 150 percent increase in sales last weekend, while consumer traffic rose 40 percent from a week earlier.
- The buying this week was not only reserved to consumers in Asia. John Paulson reaffirmed his belief in gold and reiterated his commitment to his gold holdings. From Manila, Christopher Wood noted on his latest Greed & Fear report that he is personally taking the opportunity to increase bullion holdings in his pension portfolio. He is reportedly adding another 5 percentage points to his physical gold holdings and suggests adding more if there is another dip.
Weaknesses
- The “tax” attack on gold companies continues. Following the Canaccord Genuity report criticizing the increase in bureaucracy and significant permitting delays mining companies have faced in Mexico since President Pena Nieto took office in December last year, the country’s lawmakers expeditiously approved a new 4 percent mining royalty tax on net profits. It is clear the proponents of the law have not been watching the news recently since they argue mining companies are highly profitable and have been reaping all the benefits for years. We believe the move will only serve to hurt Mexico’s hard-earned reputation as a friendly mining jurisdiction.
- Macquarie’s Equity Research continued the trend of stress testing gold producers’ balance sheets with ever lower gold price forecasts. The conclusion is that most companies that are currently engaged in the development of uber-large projects will likely be forced to defer capital expenditures or abandon projects altogether. Smaller caps without significant current production will likely bear the biggest burden as they likely have less flexibility to defer capital expenditures and some will unequivocally go out of business. However, Macquarie notes fully funded growth names such as Alamos Gold will continue to be profitable even in a sustained $1,200 per ounce gold environment.
- In 2004, gold ETFs held 0.5 million ounces. This number rose to a peak of 84.6 million ounces in December 2012. Since then, gold ETFs have liquidated 8.6 million ounces or roughly 10.2 percent of their holdings. The speculative short positions on Comex gold have receded from their February peak; however, they still stand just under 10 million ounces, levels not seen for nearly a decade. We believe it is important for investors to understand the volume of speculative flows in the gold market that create unwarranted volatility and, at times, hide the fact that gold fundamentals remain unchanged.
Opportunities
click to enlarge
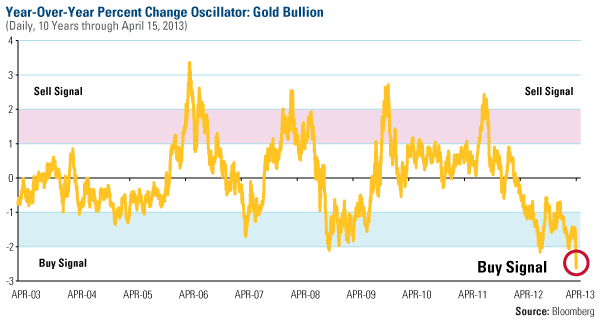
- Following Monday’s price action on gold our team analyzed the recent moves from a statistical perspective. Year-over-year going back 10 years, gold’s move is a -2.6 standard deviation (sigma) change. This price action puts the price of gold in uncharted territory because out of a total of 2,610 trading days, there has only been one such occurrence and that was precisely on Monday. The likelihood of such an event happening is 0.04 percent of the time (1/2610 = 0.04 percent). On a 60-day basis going back 10 years, gold is down 3.2 sigma. By applying the concept of mean reversion, it is quite likely that gold will rebound strongly from these levels.
- Further to our analysis, Nick Pocrnic of Stifel Nicolaus reported this week on the unprecedented price action of gold as measured by the SPDR Gold Shares ETF (GLD). The two-day (Friday and Monday) move in GLD was -16.65 at the time of his writing, which can be converted to over 8 standard deviations. He strongly believes we will not see a similar trading action in our lifetime, based on statistical analysis. He states this fall will go down in history as an aberration of truly historic proportions. As Gartman noted to put it into perspective: the sun is expected to burn out first before we see a move like that again.
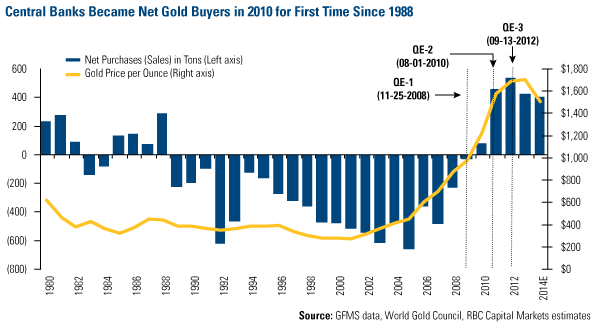
- The news that Cyprus would sell a part of its gold reserves as part of the bail-out process made many rounds around the world. What didn’t make as many rounds in the news were the comments by the South Korean and South African central banks stating gold is a key part of their international reserves they are not willing to forgo. The Sri Lankan central bank went further and declared it was looking at the price action as an opportunity to increase its bullion reserves. We are of the opinion that Sri Lanka is only one out of a large number of nations looking at buying the dip to add gold reserves.
Threats
- The fall in bullion prices over the last few days can only be described as panic selling according to Sprott Group. Money managers and veteran traders know that when panic sets in, investing logic drops by the wayside and money begins to flow one direction only. This selling in turn acts to drive prices lower, which in turn forces those holders on margin to liquidate their positions. This process leads to even more selling as the pain of holding levered "under water" positions becomes too great, causing traders to liquidate their positions. Despite the risk that this type of selling represents to the gold industry, unlevered long term fundamental investors should not be directly affected as the panic selling cannot last forever. We believe once the panic selling is over, gold will begin a slow but strong upward trend to levels that reflect its fundamental value.
- Never has it been more clear that “paper” gold and physical gold are two different assets, and rarely do we get the opportunity of demonstrating that physical gold is effectively a currency, a relatively safe currency, while paper gold is a financial asset subject to market speculation. As Jim Rickards noted on Friday, if you were a holder of physical gold on Monday, you saw the quotes falling on your screen, but when you turned around to your vault you held the same number of ounces of gold. If you owned the GLD ETF over the same trading day you would have seen your dollar trading account decreasing every minute. We are of the opinion investors are being misled into purchasing paper gold such as futures or ETFs thinking they offer the same inflation protection as bullion purchases; these behave like financial assets and pose a threat to physical gold’s claim as a safe heaven.
- Given the increasing talk of paper gold and physical gold, we would like to revisit last week’s news by ABN AMRO bank. As we reported, the largest Dutch bank sent a letter to customers stating the bank would be unable to deliver physical gold on customers’ gold claims and would instead offer a paper gold claim to its customers. The bank made the paper gold claim appear as valuable as the physical gold claim without telling investors the new “product” was subject to the bank’s credit risk, as well as to market speculation. We continue to believe this in just one of the many deliberate actions to make paper and physical gold appear like one and the same, something that mistakenly puts physical gold’s safe heaven credibility in doubt.
Energy and Natural Resources Market
click to enlarge
Strengths
- The price of natural gas climbed 4 percent this week, to another 52-week high of $4.40 per Mmbtu, on a less-than-expected storage injection following cold weather last week.
- Japan's liquid natural gas (LNG) imports rose 4.4 percent year-over-year to 86.87 million metric tons in the fiscal year ended March, the highest level since the government started collecting data in 1981. By value, LNG imports rose 14.9 percent year-over-year to a record 6.2 trillion yen ($63 billion) which in turn helped to push the country's trade deficit to an all-time high of 8.2 trillion yen.
Weaknesses
- Copper reached the lowest level in almost 18 months in London, heading for a bear market, amid concern that slowing growth from China to the U.S. will curb demand for industrial metals. Copper for delivery in three months slumped as much as 4 percent to $6,800 a metric ton on the London Metal Exchange, the lowest since October 20, 2011, and the first time since that month that prices fell below $7,000. A close at the current level would be 20 percent below the February 2012 peak, deemed a bear market by many investors.
- Brent oil has fallen below $100 for the first time since last July and WTI crude has hit its lowest point in four months due to speculation that that U.S. supplies rose.
Opportunities
- Brent oil prices have been weak recently but analysts at Deutsche Bank believe that physical oil demand will ramp up and spur a recovery in oil prices in the months ahead. Asia is undergoing an extraordinarily heavy refinery maintenance period, which they estimate should peak in April and ease sharply in June. This could mean up to 2 million barrels per day of capacity restarting which implies a significant pick up in feedstock demand. China's crude oil demand is also set to increase not only post turnarounds but for restocking purposes following five straight months of draws that have left inventories at the lowest level since March 2012.
- The coal division head of Indonesian state-owned utility PLN said that “Domestic consumption was only 18 percent of the total 2012 output as the rest was exported. But the domestic need for coal will surge in the coming years and we may have to import coal to meet the demand.” He cited research that with only 3 percent of global reserves, Indonesia was the world’s largest exporter. In 2012, Indonesia consumed 67 million tons of coal and exported 305 million tons, but by 2020, the domestic needs are expected to climb to 125.7 million tons according to the Jakarta Post.
Threats
- The Democratic Republic of Congo banned exports of copper and cobalt concentrates to force mining companies to add value to minerals before shipping them, Mines Minster Martin Kabwelulu said. Companies have 90 days to clear their inventories of concentrated minerals, he said. “We want companies to export mineral products with great added value,” Kabwelulu said. A separate letter dated April 12, attached to the decree and signed by Kabwelulu, says that companies can still export concentrated minerals for further processing if they receive permission from the mines minister, count the final metal content as coming from Congo, and pay the related taxes and fees to the Treasury.
- China’s GDP rose 7.7 percent year-over-year, the National Bureau of Statistics said. That number missed the consensus estimate of 8 percent and was below the 7.9 percent growth in the fourth quarter 2012. March industrial production gained less than estimated while retail sales growth matched forecasts. China’s industrial output in March rose 8.9 percent, the report showed. That compares with the consensus estimate of 10.1 percent and a 9.9 percent pace in the first two months combined. Retail sales grew 12.6 percent, matching the consensus forecast. Fixed-asset investment excluding rural households in the first quarter increased 20.9 percent, against the consensus estimate of 21.3 percent and a 21.2 percent pace in the first two months.
|
|
||
|
|
|
|
|
|
||
![[thumb]](/images/content_image/data/f4/f4ee4bfc4fa239cb45838cf46a55140e.jpg)
![[thumb]](/images/content_image/data/64/64abf8919e3388b7cd7c1b504cf9ca4e.jpg)
![[thumb]](/images/content_image/data/ba/bac50b1bb834c5c4a301f49c8eb9811e.jpg)
Emerging Markets
Strengths
- China’s March retail sales were up 12.6 percent, in line with market expectations. China’s home sales rose 69 percent to Rmb 1.2 trillion in the first quarter, the most growth in three years. The country’s March passenger vehicle sales were up 17 percent, and March foreign direct investment was up 5.7 percent.
- The Indonesian government is socializing the idea to increase the subsidized fuel price by 44-55 percent to 6,500-7,000 rupiah effective May 2013. If this is done, it will be one more step taken to correct the structural inefficiency in the economy, though it might temporarily cause inflation pressure.
- Chinese property names were well supported this week following comments attributed to Premier Li Keqiang that the government shouldn’t be too harsh on the sector and China should hold off on expanding the property tax across the country. In separate news, the Hainan province refused to issue housing tightening measures.
- The falling crude price, rising Rmb exchange rate, and increasing long-haul Chinese tourists traveling overseas are supporting the profitability of Chinese airline companies.
- The Korean government announced a bigger-than-expected supplementary budget of 19.3 trillion won to stimulate the economy.
- February trade balance figures for Colombia, as released this week by the country’s official statistics office, came in at $386.4 million, beating the expectations of a $204.5 million trade surplus. It is worth mentioning the Colombia peso has weakened more than 4 percent year-to-date following 100 basis points of central bank rate cuts and the lowest inflation reading in six decades. The situation places Colombia ahead of most of its South American peers who continue to battle lower commodity export prices and widening trade deficits.
Weaknesses
- China’s first-quarter GDP growth slowed to 7.7 percent versus the market expectation of 8 percent. China’s March industrial production was up 8.9 percent versus the market expectation of 10.1 percent, and fixed asset investments growth was up 20.9 percent year-to-date versus the market expectation of 21.3 percent. In the first quarter, China was busy with its leadership transition and replacing the Ministry of Railway by China Railway Corporation, which had delayed projects tendering and investments. The housing market tightening policy also was a negative factor that caused lower new housing starts and investments.
- Sina.com reported that CBRC told lenders to control total outstanding loans to local government financing vehicles, and the size cannot rise this year, citing guidelines dated April 9.
- Stock markets in Latin America had a rough week following the selloff in commodities and commodity-related industries. The Peruvian IGBVL exchange fell by as much as 7.09 percent, driven down by the heavy weight of precious metal mining companies. The Colombian IGBC stock exchange was down 3.04 percent with energy companies being the biggest laggards. Finally, Brazil’s Bovespa index was down 3.77 percent for the week with weakness across all commodity sectors.
Opportunities
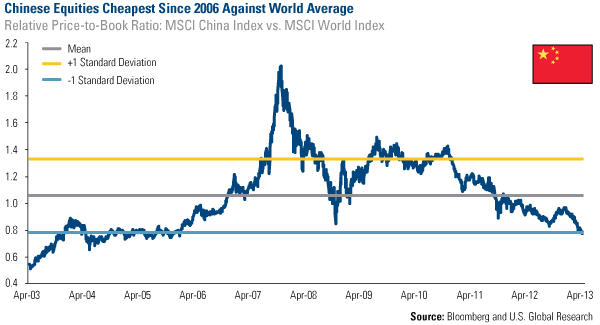
click to enlarge
- As shown in the graph above, Chinese equities represented by the MSCI China Index are one standard deviation cheaper than the world average represented by the MSCI World index. Particularly, H-share equities (Hong Kong-listed Chinese companies), as measured by the HSCEI Index, are trading at 8.7 times price-earning multiple and 3.53 percent dividend yield, the cheapest among their Asia peers.
- Turkey is planning to pass legislation to allow the government to guarantee municipal bond issues, and will facilitate the financing of big projects (such as hospital construction and the third bridge across the Bosphorus).
- The International Monetary Fund (IMF) published its updated GDP growth forecasts for the years of 2013 and 2014. The organization lowered its estimate for global economic growth from 3.5 percent to 3.3 percent in 2013. However, the report also highlighted the expected greater than average growth in most Latin American nations. The GDP growth estimates for Paraguay and Peru are above 6 percent, while Bolivia, Chile, Colombia, and Ecuador are predicted to grow at a rate greater than 4 percent. The IMF attributes the outperformance to strong internal demand as well as favorable financing conditions.
- Primary spending has increased as a share of GDP in a number of emerging market countries, and this has helped to contribute to a steady increase in the emerging markets trade deficit against a background of weak export growth – but lower oil prices might slow this trend.
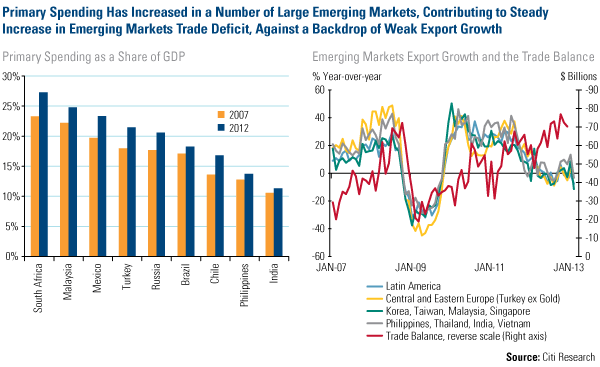
click to enlarge
Threats
- China’s housing tightening policy showed its negative effect in slowing down GDP growth in the first quarter.
- In Malaysia, questions have been raised over the use of non-financial public sector enterprises (NFPEs) under the Economic Transformation Programme (ETP). While the Federal government deficit fell to 4.5 percent of GDP in 2012 (from 4.8 percent in 2011), the consolidated public sector deficit, which includes NFPEs, was projected to surge to a record 10.5 percent of GDP in 2012 (from 3.3 percent in 2011).
- Mexican lawmakers approved legislation requiring mining companies to pay a 4 percent royalty on net profits before taxation. Projects that are not yet in production will be taxed on a per-hectare amount to be defined. Lawmakers anticipate the new tax will bring $250 to $500 million per year in additional tax revenues, of which mining municipalities will retain 70 percent. In our opinion, the new law goes against President Pena Nieto’s proposed program to increase competitiveness across the country as the platform for future growth.
© US Global Investors


