What's Driving Emerging Markets?
Summary
Emerging market (EM) equities have historically outperformed as the global economy gained momentum, as shown in Exhibit 1. After a great catch-up rally in the second half of 2012, the stocks finished the year as global outperformers – only to lose that momentum in the first quarter of 2013. What is behind the recent underperformance, and what does it say about the outlook? Our research points to a number of contributors to the recent weakness. First, there has been significant outperformance by those markets whose central banks are undertaking aggressive quantitative easing (Japan and the United States). Second, growth concerns tied to both the trade impact of yen weakness and China’s cyclical growth outlook have also been factors. While we will also review in this report some longer-term concerns around emerging markets, such as lowered profitability and increased credit growth, we do not think these are new concerns that explain the stocks’ recent weak performance. We remain positive on the long-term outlook for emerging market economies and stocks, as the growth differential and valuation discount as compared to developed market economies should generate attractive returns. Near-term, the stocks will need an improvement in relative economic momentum to start outperforming those economies with more stimulative central bank policy.
Exhibit 1: A Beneficiary of Global Growth (Usually)
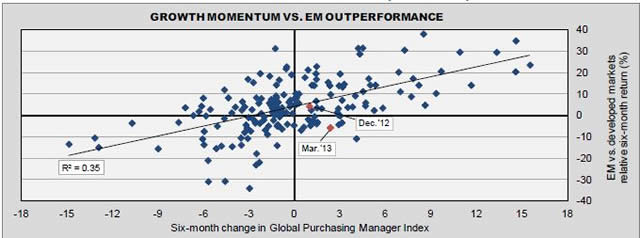
Source: Northern Trust, Bloomberg. Data from 7/31/1998 through 3/31/2013. R2 (r-squared) measures the percentage of a fund's movement that is explained by movements in the market index.
In looking at historical exposure to growth, we examined the relationship between emerging markets performance (relative to developed markets) and the Global Purchasing Manager Index (PMI). As anticipated, emerging markets have historically outperformed when global growth is gaining momentum with a 59% correlation (and r-squared of 0.35) during the study period (July 31, 1998 to March 31, 2013). However, as shown in Exhibit 1 above, the global PMI has increased nearly three points over the past six months – and yet emerging markets have underperformed by approximately 7% during the same period. So the level of underperformance is noteworthy in a historical context.
One source of emerging market underperformance is its traditional dependence on exports and the sector composition (as shown in Exhibit 2). Emerging market stock indexes have been under-exposed to the best-performing sectors so far this year. The MSCI Emerging Market index has relatively small exposures (vs. the MSCI Developed Market index) in the following sectors: health care, industrials, consumer discretionary and consumer staples, which happened to be the four best performing global sectors in the first quarter. Health care, in particular, took its toll on relative performance; the sector returned 14.3% on a global basis yet it is only a 1.3% weight in the Emerging Markets index. However, sub-optimal sector composition cannot take full blame. As seen in the right panel of Exhibit 2, all sectors in the Emerging Market index trailed its Developed Market index counterpart to varying degrees.
Exhibit 2: Exposed In the Wrong Places
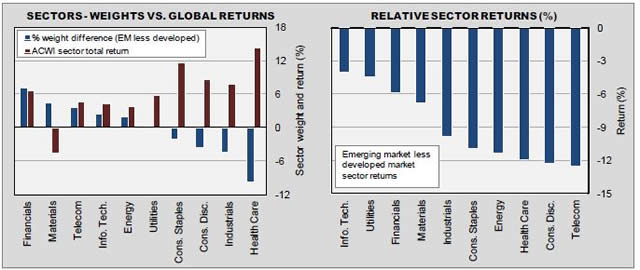
Source: Northern Trust, MSCI, Bloomberg. Weights as of 3/31/2013; returns are year-to-date through 3/31/2013.
Emerging Markets’ biggest sector overweights are in cyclical sectors (with the exception of the traditionally defensive telecom sector) including financials, materials, information technology and energy. These sectors generally perform well in “risk on” environments but have not done so thus far in 2013. Our expectations for global growth are constructive toward the United States, emerging markets and increasingly Japan. European growth continues to be hindered by their austerity measures, which we do not expect to ease in 2013. Based on this generally positive view on overall growth trends, we would expect the more cyclical parts of the emerging markets to regain momentum as the year progresses – supporting the relative performance outlook for these stocks.
We also analyzed the recent performance by country to isolate areas of strength and weakness. As shown in Exhibit 3, China is the largest contributor to the underperformance – followed by the other “BRIC” countries – (Brazil, Russia and India). Also suffering from poor returns are Korea and South Africa, expanding the acronym to “BRICKS.” One theory is that the underperformance of the broader emerging market region is directly due to underperforming Asian nations, which are dealing with a softening outlook from China, as they attempt to quell their persistent housing price pressures. Additionally, emerging Asian countries are dealing with the prospect of stepped-up competition from Japan, as Japan’s new approach to monetary policy depresses the yen and makes Japanese exports more competitive. Looking at total returns at the country level, we actually find that Asian countries held the top three spots – the Philippines (19.0%), Indonesia (13.4%) and Thailand (10.1%). What the Philippines and Thailand have in common, is much greater export exposure to the United States than to China – providing some stability in their outlook.
Aggregating the regions at the total return level, Latin America returned a positive 0.9% for the first quarter, while Europe, Middle East and Africa (EMEA) was the worst-performing region, generating a loss of 5.7%. Asian emerging market stocks dropped 1.7% – with the performance of the Philippines, Indonesia and Thailand more than offset by China (-4.5%), Korea (-3.2%) and India (-2.6%). Aggregating the contribution to performance by region, we find that EMEA is the biggest culprit – detracting 97 basis points, while Asia detracted 72 basis points. The Asian impact is outsized due to its proportion within the index – 61% as compared to 21% for Latin America and 18% for EMEA.
Exhibit 3: The “Bricks” Are the Laggards
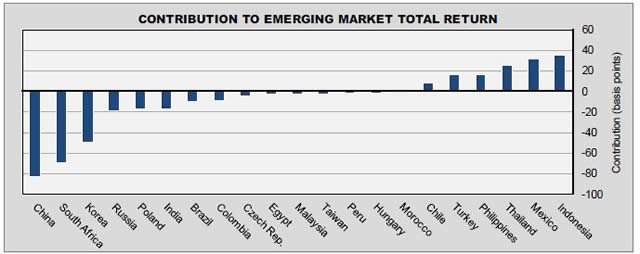
Source: Northern Trust, Bloomberg. Data is year-to-date through 3/31/2013.
In addition to the direct correlation of emerging market stock performance to global growth momentum, we believe the near-term momentum of Chinese growth is a key driver of performance. The new orders component of China’s Purchasing Managers Index started rising in August 2012, increasing steadily through January 2013 – underpinning the recovery of EM shares. However, the index fell in February 2013 as did a good measure of Chinese economic activity (freight volumes, as shown in Exhibit 4). While much of this slowdown could be tied to the distorting impact of the Chinese Lunar New Year, the markets were waiting for March data to help fill in the picture – and the data was modestly disappointing.
With Chinese GDP reported at 7.7% for the first quarter, below market expectations of 8.0%, the commodity complex remained under pressure and emerging market stocks experienced selling pressure. The magnitude of the growth shortfall was fairly small (a proportionate miss in the United States would be GDP reported at 2.41% instead of 2.5%). Several of the details of the growth were disappointing, with industrial value-added up 9.5% in the quarter but up just 8.9% in March. Other measures showed a similar lack of bounce back in March, which was expected after the Lunar New Year disruption. For perspective, China’s growth in 2012 was 7.8% and their target for 2013 is 7.5%.
Looking at global growth trends in early April, we find that of the seven major economies with PMI levels above the world level (United States, Taiwan, China, Mexico, Denmark, Brazil and South Korea) five are emerging economies. Of the 14 major economies with PMIs that are contracting, 11 are developed economies. So the emerging world continues to demonstrate the strongest growth dynamics. Having said that, relative momentum has slowed over the last 30 to 60 days, with the PMIs for Brazil and India both down (to a still expansionary level) in April.
Exhibit 4: Chinese Data Drives EM Eentiment (and Stocks)
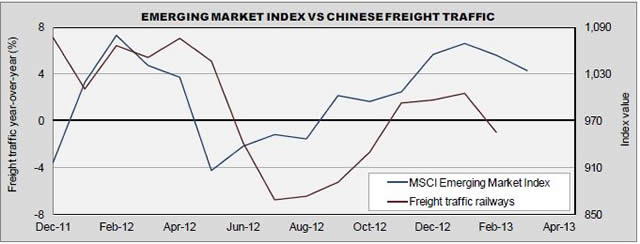
Source: Northern Trust, Bloomberg. EM index data through 3/31/2013; freight traffic data through 2/28/2013.
Skepticism remains over the quality of China’s economic data, as official figures describe an economy with much steadier growth than seems credible. However, when considering the availability of other data (such as electricity generation, loan volumes and freight traffic), investors do get a more complete picture of the growth pace. The Federal Reserve Bank of San Francisco has analyzed the Chinese growth numbers (“On the Reliability of Chinese Output Figures,” John Fernald, Israel Malkin, and Mark Spiegel, March 25, 2013), and has given China a qualified certification. They find no evidence that China’s 2012 growth slowdown was greater than officially reported, but they can’t reach a conclusion on the long-term accuracy of the Chinese GDP statistics.
A longer-term concern facing the emerging market economies is growth in overall credit outstanding. The public sector (governmental) debt has been well-managed, and broadly, across emerging markets, is comparable or lower than what existed before the financial crisis. As shown in Exhibit 5, public debt levels in China, Brazil and India have been steady and reflect the lessons learned in the late 1990s emerging market debt crisis. In contrast, however, is the considerable ramp-up in private sector debt across the emerging markets. While India’s overall private debt hasn’t increased significantly, both Brazil and China have seen noticeable increases. In China specifically, the increase in non-bank lending (also called social financing) has been significant but is a phenomenon that has been a major force in lending since 2009. While there is concern about these “wealth management products” running amok, these institutions are controlled by the Communist Party – like the banks. In addition, there are market concerns over the “bubble status” of China’s housing market, where prices continue to march upward despite the efforts of the government. Mitigating the risk of a housing bubble is the fact that mortgage finance rules are tight in China, and down payment levels are very high. This reduces the risk of credit losses that could create financial market strains. The seemingly insatiable demand for housing is a result of the high level of savings in the country and the lack of investment options. With the Chinese stock market still down 60% from the peak set in September 2007, the public mood toward equity investing is cautious.
Exhibit 5: Private Leverage, Public Rectitude
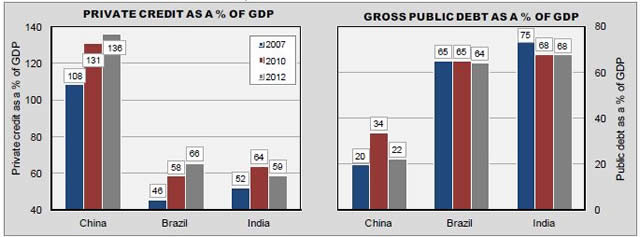
Source: Northern Trust, BIS, IMF. Note: Private credit data through 9/30/2012; 2012 public debt data based on IMF estimates.
The growth in Chinese private credit is somewhat overstated, and the public debt understated, by the inclusion of local government financing vehicles (LGFV) as private debt. They are not included in the gross public debt because they are not technical obligations of the central government, but investors assume that Beijing will in some fashion renegotiate or backstop any serious credit problems as the debt was likely issued with the government’s agreement.
Overall credit growth in emerging markets has been rapid during the post-financial crisis period, raising questions about the return on investment. In the countries where the “private” credit is public debt in disguise, the credit worthiness of the central government is key. With Beijing’s foreign exchange reserves hitting a new record level in March 2013 (US$3.44 trillion), along with a closed capital account, they face little financial market pressures around debt restructuring. Looking across emerging markets broadly, total private credit in emerging Asia (including China) ranges from 125% to135%, while it is nearing 200% in South Korea. It is much lower in other emerging economies, such as Mexico (25%), India (59%), Brazil (66%) and South Africa (75%). To put these levels in perspective, the comparable figures for advanced economies include Sweden at nearly 240%, Switzerland and the United Kingdom at 200%, the United States at around 150% and Germany at 120%. Over the last decade, the great majority of emerging market debt has been issued in local currencies – reducing the risk of financial market stress due to currency depreciation. In this circumstance, a depreciating currency may actually serve to boost economic growth and increase debt service capability.
There has been some deterioration in profitability of emerging market companies over the last two years. After generating return on equity (ROE) comparable to U.S. companies over the prior eight to nine years, emerging market companies have seen their ROE fall from a peak of 15.7% in June 2011 to 12.9% in March 2013. Not surprisingly, as profitability decreased over this period, earnings growth momentum also significantly decreased. As displayed in the right panel of Exhibit 6, year-over-year earnings growth (measured on a 12-month rolling average basis) steeply declined from over 60% in June 2011 before bottoming at -10.2% in February 2013 (comparable to that experienced in Developed ex-U.S. markets). While the United States has seen earnings momentum suffer, the rate of decline has not been nearly as pronounced and year-over-year earnings growth has remained positive throughout the period.
Exhibit 6: Downshifting Profitability
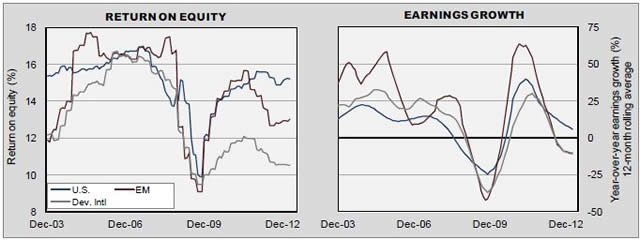
Source: Northern Trust, Bloomberg. Note: Developed international data is adjusted for negative earnings. Data through 3/31/2013.
While some of the decrease may be attributable to a weak export market in the European Union, a much larger impact is likely due to a secular shift to higher wages across important emerging market economies. Chinese companies cite rising or high production and labor costs as their biggest challenges, and other Asian emerging economies have faced similar economic pressure to raise wages. Minimum wage rates have increased in Indonesia, Thailand and Malaysia over the last year. A boost in minimum rates in Taiwan is cited as a factor in the successful reelection of their President. This longer-term shift toward higher wages will help support the movement toward greater reliance on consumer spending, a key policy initiative in many emerging economies. Fortunately, both the ROE and earnings growth appear to have stabilized in emerging markets over the past six months and may be reaching an inflection point. The return on equity levels are still at respectable levels and compare favorably at 13.0% to Europe (10.9%) and Japan (6.0%). In 2013, earnings in emerging markets are forecast to lead the world along with Japan at approximately 15%, while the United States and Europe are expected to generate roughly one-half that pace of earnings growth.
The recent underperformance of emerging market stocks has improved their valuation levels relative to global equities. The current developed market price-to-earnings (P/E) ratio of 16.8 times is slightly above the median level of 16.2 times from the last 10 years while emerging markets, trading 12.1 times earnings, represent a marginal discount to a median level of 12.9 times. Considering a 20-year timeframe, both developed and emerging markets’ current P/E ratios are well below the historic median levels of 21.0 times and 14.7 times, respectively.
The relative emerging and developed P/E ratio has been declining since the end of 2010; the latest observation of 0.72 times is the lowest in more than three years and noticeably below the 0.81 times median level. The decline during the last year in the relative P/E ratio has been due to an expanding multiple in developed markets rather than a contracting multiple in emerging markets, indicating that the developed markets have benefitted from strong investor sentiment putting a higher multiple on corporate earnings.
Exhibit 7: Emerging Markets Are Attractively Valued
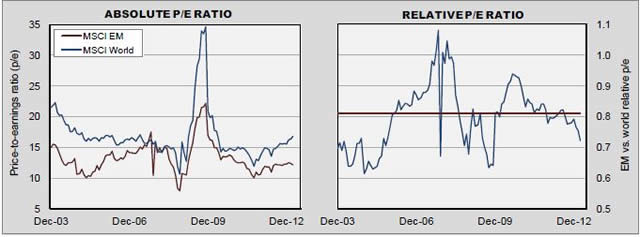
Source: Northern Trust, Bloomberg. Data through 3/31/2013.
Looking at alternative valuation frameworks, emerging market shares also look attractive. From an income standpoint, emerging market stocks carry a dividend yield (2.7%) comparable to global equities (2.6%), and a price-to-book valuation of 1.5 times as compared to global equities at 1.8 times.
Conclusion
Our research indicates that emerging market stocks remain a leveraged play on global growth and the recent underperformance is not an unusual occurrence. There are legitimate near-term fundamental concerns over two issues – the impact of yen weakness on exporters and the cyclical state of the Chinese economy. We believe that the short-term negative impact of the yen weakness could be offset by intermediate-term improvement in Japanese demand. The ripple effect of the world’s third largest economy growing again could be an unexpected benefit to its trading partners. On China, we still expect their economy to deliver growth near the 7.5% target for this year and, therefore, avoid a hard landing. The country’s transition from an export and investment-led economy to one more dependent on domestic consumption is a long-term change and will likely include some turbulence. Over the last several years, there has been a build-up of private sector debt across the emerging markets, but overall debt levels are not worrisome and currency risks have been mitigated. Finally, the recent underperformance of emerging market shares has further improved their valuations relative to developed market equities. We think this improves their long-term return outlook, and remain overweight in our global tactical asset allocation portfolio.
IRS CIRCULAR 230 NOTICE: To the extent that this message or any attachment concerns tax matters, it is not intended to be used and cannot be used by a taxpayer for the purpose of avoiding penalties that may be imposed by law. For more information about this notice, see http://www.northerntrust.com/circular230.
IMPORTANT INFORMATION: This material is for information purposes only. The views expressed are those of the author(s) as of the date noted and not necessarily of the Corporation and are subject to change based on market or other conditions without notice. The information should not be construed as investment advice or a recommendation to buy or sell any security or investment product. It does not take into account an investor’s particular objectives, risk tolerance, tax status, investment horizon, or other potential limitations. All material has been obtained from sources believed to be reliable, but the accuracy cannot be guaranteed.
PAST PERFORMANCE IS NOT INDICATIVE OF FUTURE RESULTS. Periods greater than one year are annualized except where indicated. Returns of the indexes also do not typically reflect the deduction of investment management fees, trading costs or other expenses. It is not possible to invest directly in an index. Indexes are the property of their respective owners, all rights reserved.
No bank guarantee | May lose value | NOT FDIC INSURED
© Northern Trust


