This week we take a quick look at some of what is in the President’s budget and then focus on the housing market (the title harkens back to something we wrote a few months back). You may sense, as you read on, I’m a bit cranky this week. As you read through the housing section you’ll understand why.
The President’s Budget and the Sequester
I’m keeping this really short given budget talks and tax reform will keep our government busy for months as they try to pass a budget for the first time in years. I guess the good news is at least a budget has been presented. The not so good news is that, at least publicly, it is being called DOA. As it relates to the muni world, there are important provisions we all will be watching closely over the coming months – tax-exemption and caps, America Fast Forward bonds and the creation of an Infrastructure Bank. I had thought about providing a summary or perspective but, given these provisions will evolve materially, probably most important to have our readers focus in on the importance of maintaining the tax-exemption. In this regard, I refer you to last week’s guest commentary from Ron Bernanrdi and to not be shy about letting your perspective be known to your elected representative. The Bond Dealers of Americaand Municipal Bonds for America are doing great work on the advocacy front for our industry. Reach out to them to lend your perspective and/or support.
As for the Sequester, it seems that whatever bad occurs since the Sequester is the fault of the Sequester. The Heat’s streak ended – Sequester. It snowed in Minnesota in April – Sequester. North Korea – the Sequester. At least, that is how it is portrayed. One man’s view. Whatever bad occurs as a result of the Sequester is the fault of our elected officials who did not have the sense to reach compromise for 16 months and do not have the sense to, at a bare minimum, make changes to give government agencies the ability to use allocated budget funds in a way that is best for the country (across accounts) as opposed to strict account cuts within agencies. Wouldn’t it be something if our elected officials had to be subject to all the same rules, requirements and impositions we are learning to live with? If only they had to stand in security lines at airports. Maybe they will feel the impact when they miss out on Fleet Week photo ops (yes, that is now the subject of a possible cut). Enough for now – however, so much more to say on the topic.
Housing – Is It As Good As Suggested?
The release of foreclosure data this week has spurred talk that the data confirms the housing market is back to where it was pre-recession and all is well in this important segment of the market. After all, it is a component of one’s assets (albeit declining – see below) and a driver of tax receipts for municipalities across the country (thank goodness for mil rates).
According to RealtyTrac, the number of foreclosures are at a point consistent with where they were in late 2007 (remember the good ol’ days). We decided to take a look at some other data and remind our readers of some interesting tidbits heard around the water cooler (actually some fairly prominent publications).
First the data. The table below shows States where the Delinquency Rate for residential mortgage payments is greater than 7% (the 12 month average is about 6.9%) and where the Foreclosure Percentage is greater than it was one year ago.
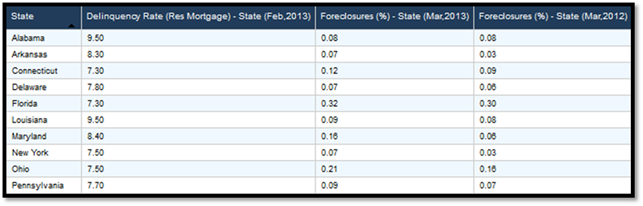
DIVER Analytics, Filter Module; RealtyTrac, BLS, Lender Processing Services.
While not exactly supportive of “all is well” you can certainly argue that “its not so bad.” We all recognize there are pockets of the country where things are not what they once were. However, we do suggest you look closely at the above entries – some pretty big issuers.
Next, we look at what has been happening to Homeownership Rate over the past few years. I really tried to find a silver lining here but it seems the editorial in Friday’s WSJ and some other articles I happened upon may have a point – investors are buying up properties as opposed to Mom and Pop purchasers. Using the most recent data from the US Census Bureau:

![]()
![]()
DIVER Analytics, Filter Module; US Census Bureau.
We round out the housing data picture with a picture showing House Price Change. The below gives us further insight into if we really are back to pre-recession levels or better. A clue – only green and blue are better than 0.

DIVER Analytics, Map Module; FHFA.
I’m sorry. I feel like the “Mayhem” guy from the Allstate commercials. Good thing I’m not alone. Ed Pinto had a piece in the April 10 Wall Street Journal, Is the Fed Blowing a New Housing Bubble, and noted the following:
Over the past year … housing prices have jumped 8%, the biggest gain since 2006 [revisit the above and think what the map looks like without the 8% gain over the past 12 months].
… [H]ome prices are being levitated by quantitative easing.
The government continues to go to extraordinary lengths to prop up sales by guaranteeing nearly 90% of new mortgage debt, financing half of all home purchase mortgages to buyers with zero equity at closing, driving interest rates to the lowest level in 100 years, and turning the Fed into the worlds largest buyer of new mortgage debt. [Emphasis courtesy of yours truly].
When it comes to interest rates, whatever goes down must go up.
If mortgage rates were to increase to 6% in three years [from 3.5% today], some combination of three things would have to happen to keep the same level of homeownership affordability. Incomes would need to increase by a third, house prices would need to decline by a quarter, or lending standards would need to be loosened even further [is that possible?].
Sobering thoughts indeed. In the context of the municipal market, it makes one hope the printing press stays on a good long time (while we all hope our paychecks rise by a third, it is difficult to see given how income levels barely keep pace with the real growth of expenses – you know, when you include food and energy!). So, housing prices, homeownership, tax receipts are on our radar screen especially if/when the Fed stops printing (or buying – whatever you like).
The DIVER Muni Index

DIVER Analytics, Map Module; Lumesis.
This week, a look at the DIVER Muni Index at the county level showing the combined point in time and trend year on year. The lower the number (lighter the color on the map) the better.
One last point. Referring back to the budget and tax reform. I fear that, as our Federal Government takes steps to get its house in fiscal order, the exercise will, at the end, be nothing more than a burden shift to the States and local municipalities. I recognize tough choices need to be made but the muni community needs to ensure the needs and concerns of municipalities are heard. This means speaking up about tax-exemption and cost shifting.
Have a great week.
Gregg L. Bienstock
CEO& Co-Founder, Lumesis, Inc.
This Week’s Data :
- Drought Intensity, County, 4/09/2013
- Foreclosures, County and State, March 2013
- Delinquency Rate (Res. Mortgage), State, February 2013
- Weekly Initial and Continued Jobless Claims, State, 3/30/2013
- Unemployment and Unempl. Rank Change, February 2013, County
- UPDATED: Bankruptcy Filings - Issuers, County, 2013
- UPDATED: Default Filings - Issuers, County, 2013
- UPDATED: Muni Index, Pt. in Time/Trend, County, April 2013
© Lumesis


