Conflicting data and information is everywhere. The equity markets make new highs, the talking heads on the various business shows talk of the new bull run, unemployment is down and a recent article in Barron’s highlights the fact that “State tax revenues have increased for 11 quarters running fueled by a recovery in home prices” (citing BlackRock). Others challenge the recently released employment numbers saying the headlines do not tell the whole story and, once the Fed steps back and the inevitable budget cuts (less increases) come, the economy’s true status will be revealed. I wish I can say we know who is right and who is wrong.
U-6 (its not a sub)
For the sake of so many, I was happy to see the unemployment rate decline and the number of new jobs created increase. Many folks have been through some tough times and it was heartening to see the seeming trend moving in the right direction. While I am still waiting for detailed data at the State and county level, some of the national data details are worth noting. First off, the number of folks categorized as “involuntary part-timers” for February was almost 8 million up from 7.7 million (a recent low) from March 2012. Labor Underutilization, also known as U-6, includes those that want full-time work but have taken part-time work – involuntary part-timers. The most recent data available is presented below. While the official unemployment rate reported last week was 7.7%, we can find only one State with a U-6 figure that low.
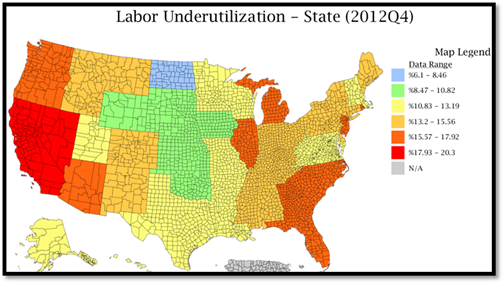
Source: DIVER Analytics, Map Module; Bureau of Labor Statistics
That said, there is good news. Looking back one year, U-6 is up in only two States - Delaware and New York. Perhaps things are getting better.
State Tax Revenue
With the employment picture improving, one would be hard pressed to challenge the notion that that State tax revenues have increased for 11 quarters. We want to know if this is true for all, most or some States or if some States are being “carried” by others. Using data from the 3rd quarter 2012 and looking back 3, 6 and 9 quarters, we find that 29, 37 and 19 States, respectively, had greater Tax Collections (meaning 21, 13 and 31 didn’t). How many States had tax revenue greater for all of those periods?

Source: DIVER Analytics, Filter Module; US Census Bureau
I am not diminishing the positive here – that State tax revenue is on the rise in many States – I am simply reminding readers of the importance of exploring the details under the sweeping headline statements.
Food Stamps
One measure of the economy and how folks are really faring is Food Stamp Participation Change, a data set we track at Lumesis. It ain’t pretty. Looking back from December 2012 to December 2011, 41 States and territories have seen an increase in food stamp use.

DIVER Analytics, Map Module; US Department of Agriculture
As we seek to paint pictures with broad brushes, it is important that we look back to a point in time that makes the most sense for our own analysis. Be it a State, county or other municipality, what happens in that locality is surely more important than what is characterized in a sweeping statement. The proof is in the details.
Market Risk and Credit Risk
Part of our purpose in creating the DIVER suite of products was to create a robust database and analytical that allows our clients to look beyond stale financials, broad statements and a simple rating. We generally focus on economic and demographic data as primary drivers of fiscal well-being of municipalities. Essentially, we seek to encourage enhancement to the robust credit analysis process of our clients. Where am I going with this? Risk.
Attendance at recent industry events has me thinking about Market and Credit Risk, the Fed funds rate, spreads, bond prices and muni bond performance over the past few years. We all have heard that rates, at some point, will rise. Undoubtedly, this will occur once the Fed slows or discontinues its buying binge (see last week’s commentary) and then, subsequently, raises rates (essentially, unwinding what has been policy for several years). A speaker at one conference caught my attention when she inquired how aggressive regulatory enforcement will be when bond prices retreat and rates rise. Paraphrasing her:
When the market value of Mrs. Smith’s portfolio declines by 15% and she complains, will we be taken to task for selling that bond?
The response centered on disclosure of market and credit risk and the speaker pressed on to ensure that there was nothing additional she or her firm should be doing in these times of exceptionally low rates. As you can imagine, no guarantees were given and, as they say, time will tell.
This led me to take a look at what types of disclosure about credit and market risk I might find on a well-known brokerage firm’s time of trade disclosure (the name and reference to the firm has been removed).
Credit Risk: A bonds credit quality is an important consideration when evaluating investment choices. Credit raters may assign a credit rating to a bond and/or issuer based on the issuer’s financial condition and management, economic and debt characteristics, and specific revenue sources securing the bond. The highest ratings are AAA (Fitch and S&P) and Aaa (Moody's). Bonds rated in the BBB/Baa category or higher are considered investment-grade; bonds with lower ratings are considered higher risk, speculative or high yield. Lower rated bonds will often have higher yields to compensate investors for increased risk. Issuers may pay a premium to an insurer, who provides interest and principal payments in the event the issuer fails to do so. The credit rating of insured bonds can be higher than that of the issuer. In the case of insured municipal bonds, it is important to evaluate and know the rating of the insurer and issuer. The rating of the issuer is sometimes referred to as underlying ratings.
Market Risk: The risk that the bond market as a whole will decline, bringing the value of individual securities down with it regardless of their fundamental characteristics.
A couple of things. First, I think I am changing the firm I use. Second, if this is the standard disclosure of the speaker’s firm, they very well may have some unhappy clients when rates rise and the market value of portfolios sink.
The reality is that while muni bond portfolios have performed quite well over the past couple of years, what goes up just may come down. And, when it does, will your firm’s “be taken to task for selling that bond?”
Given disclosure is at the fore of regulation these days, your views on credit and your firm’s views on risk need to be communicated to your clients – all of your clients. We encourage our readers to revisit their approaches for credit information dissemination and their presentation and delivery of timely information in a concise yet comprehensive form. Can your firm customize information to reflect market conditions worth explaining a bit further. If (when) markets reverse course, those that were chasing yield may just be asking why you felt comfortable selling me these bonds. Just look at the data above and in recent reports.
Gregg L. Bienstock
CEO& Co-Founder, Lumesis, Inc.
This Week’s Data :
- Population #, County, 2012
- Drought Intensity, County, 3/12/2013
- Weekly Initial and Continued Jobless Claims, State, 3/02/2013
- Foreclosures, County and State, February 2013
© Lumesis


