The Fed’s aggressive monetary policy teamed with its inability to jump-start the anemic economic growth pattern has challenged investors’ quest for yield entering 2013. We offer investors the following for consideration as they seek yield in this environment:
- Higher-quality high yield (HQHY) has outperformed lower-quality high yield over time.
- HQHY securities have historically exhibited less volatility than the high-yield market in general.
- HQHY securities exhibit relatively low correlation to Treasury returns. This may be appealing for investors concerned with the eventual risk of inflationary pressure and/or rising Treasury rates.
The impact of Fed easing has resulted in record low absolute-yield levels across traditional fixed-income investments such as money market funds, Treasuries, mortgage-backed securities and investment-grade corporate bonds. Assuming the pressure from the Fed to take on additional duration or credit risk eventually concludes, a cautious approach to garnering additional yield beyond these traditional investments may be warranted.
Yield History
12/31/08-12/31/12

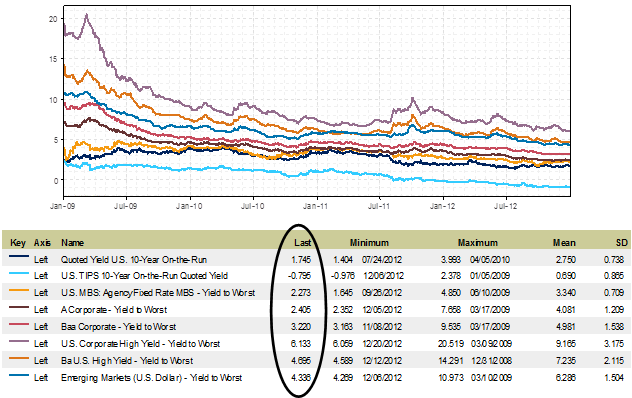
Source: Barclays Capital, Barclays Live – Time Series Plotter . Past performance does not guarantee future results.
Capital has moved into higher-yielding fixed-income investments that the most conservative fixed income investors may have previously chosen to avoid, such as high-yield corporate bonds. Flows into the high-yield market have caused dramatic price appreciation and a general decline in yields to record levels. While high-yield bond investing is an appropriate investment consideration in the context of an overall portfolio, the significant increase in demand for these securities should carry with it a likewise increase in caution.
It is our belief that higher-quality segments of the high-yield market may offer some respite from valuation concerns while still offering investors the investment characteristics that have driven capital flows into the high-yield market.
Historical Risk/Return Profile within the High-Yield Market
The Barclays U.S. Corporate High Yield Ba Index has achieved relatively more total return than the Barclays U.S. Corporate High Yield Index since inception.
Barclays Indices Relative Performance
Growth of $10,000
8/31/83-12/31/12
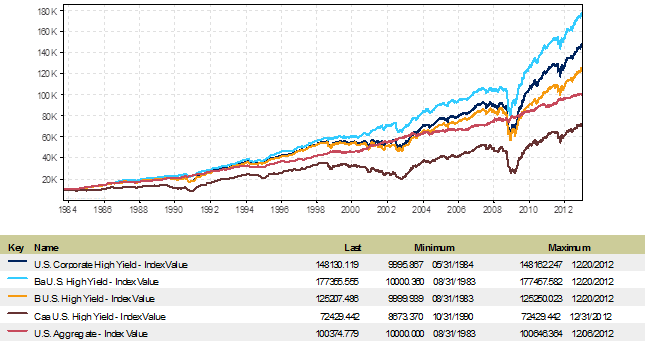
Source: Barclays Capital, Barclays Live – Time Series Plotter. Past performance does not guarantee future results.
The data shown in the above graph is somewhat inconsistent with generally accepted investment theory, which suggests investors will require higher returns over time as compensation for higher risk. While the Barclays U.S. Corporate High Yield Index has outperformed the Barclays U.S. Aggregate Index, the BB universe (represented by the Barclays U.S. Corporate High Yield Ba Index) has outperformed lower-rated B and CCC rated bonds since the availability of the index data. Assuming lower-rated bonds in general do carry more credit risk, there must be market inefficiencies contributing to this outperformance by higher-rated credits within high yield. We believe this inefficiency is due to an element of friction between the investment-grade and high-yield bond markets, creating an opportunity for high-yield investors that have a higher-quality bias.
Factors contributing to market inefficiency and opportunity include:
- Many institutional accounts are not allowed by their charters to hold high-yield securities causing forced sales on downgrade and bonds to be offered at a lower price than their intrinsic value.
- Immense demand for bonds upgraded to investment grade as they enter the investable universe of a much larger number of potential investors. The search for additional yield opportunities causes valuations of such securities to gain momentum as they move to investment grade.
- It would be naïve to suggest that rating agencies are omniscient and unbiased by cognitive tendencies or aversion to career-risk decisions. It also would be wrong to assume that the intrinsic value of a security moves lock-step with a credit rating that is subject to these biases. Opportunities become available when rating agency opinions impact bond valuation more than any shift in the bond’s underlying intrinsic value. Investors that are positioned in front of agency moves can exploit the shortcomings of investment managers whose investment universe is dictated by the rating agencies.
- Covenants on high-yield bonds can be burdensome. When a high-yield issuer is acquired by an investment-grade company or moves to investment-grade status, this often results in the bond trading to an earlier call date/tender offer or receiving a guarantee/payment to remove the covenants.
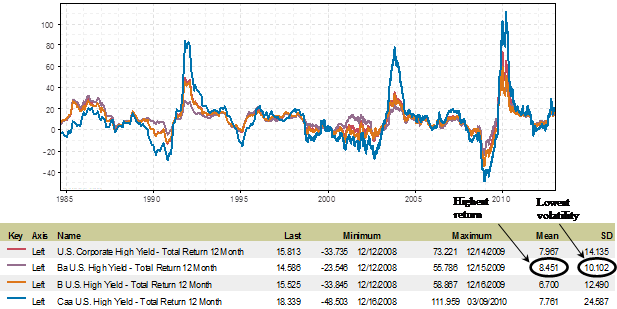
In addition to the more significant returns HQHY has exhibited over time, that segment of the high-yield market also demonstrates less volatility.
LTM Total Return History
8/31/84-12/31/12
![]()
Source: Barclays Capital, Barclays Live – Time Series Plotter. Past performance does not guarantee future results.
The previous graph illustrates trailing twelve month returns achieved for various credit-quality components of the high-yield market over time. The more limited standard deviation of returns for higher-quality issues appeals to investors focused on principal protection or those seeking to take on less “mark-to-market” risk within their high-yield portfolio. The 10.1% standard deviation of the Barclays U.S. Corporate High Yield Ba Index sits favorably inside of the Barclays U.S. Corporate High Yield Index at 14.1% and the lesser-quality components of the high-yield market.
Relative Value within the High Yield Market
While high-yield spreads are inside of their mean (see chart below), it’s not excessive given the benign credit environment and alternative investment options. As of 12/31/12, high-yield investors demanded only 539 basis points (bps) of spread above Treasuries versus a historical average of 653 bps since 12/31/98. The high-yield market’s yield and return potential is still judged favorably by many relative to other more conservative fixed income investment options despite receiving 114 bps less in spread compensation versus the measured average. The higher quality Ba rated securities also trade inside of their mean, although not as severely at about 56 bps. In addition, credit spreads on Ba rated securities as of 12/31/12 are still at over two times the minimum level achieved in 2005.
While investors may be willing to accept this lower spread level as a result of the benign credit environment, they must keep in mind today’s high dollar prices relative to the callable nature of most bonds in this market limits upside potential. With such limited upside, perhaps these subdued spreads are not as generously compensatory for the subdued credit risk environment.
Spread History
12/31/98-12/31/12
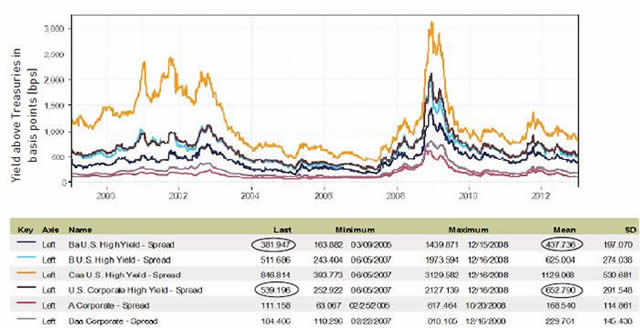
Source: Barclays Capital, Barclays Live – Time Series Plotter. Past performance does not guarantee future results.
The yield advantage by rating illustrated below signals that the additional compensation an investor receives by moving further down the quality spectrum gets more meaningfully narrow relative to historical averages. For example, while investors have required 178 bps of additional yield on average to move from higher quality BB rated issues into B rated securities, they only received an additional 110 bps of yield through making such a move at 12/31/12. The incentive to move from BBB rated securities into BB has recently been more limited as well; however, such an investor still picks up an additional 148 bps of yield versus a mean of 178 bps. With the limited pick-up in yield and limited upside potential, perhaps investors are most adequately compensated through targeting higher-quality credit risk within the high-yield market and avoiding the lowest-quality high-yield names.
Yield Advantage by Rating
12/31/98-12/31/12
![]()
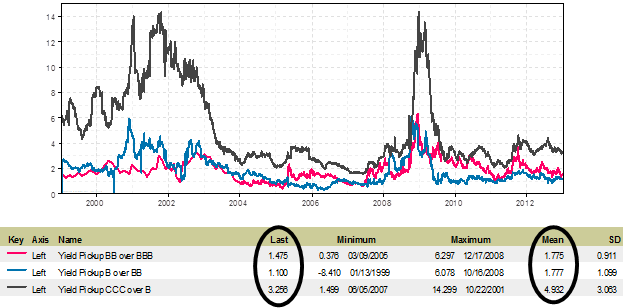 Source: Barclays Capital, Barclays Live – Time Series Plotter. Past performance does not guarantee future results.
Risk of Rising Rates
High-yield securities’ excess yield offsets a rise in general rates more than lower-yielding alternatives. These securities also have the potential for spread tightening during inflationary environments or rising rate episodes that coincide with improving economic conditions. Investors that are concerned about eventual inflationary pressure or a general rise in interest rates from current levels may be comforted somewhat by the resulting lower historical correlation of returns exhibited by the high-yield market in relation to ten-year U.S. Treasury bonds.
Monthly Return Correlation versus 10yr Treasury
1/01/93-12/31/12
|
Mortgage Master |
0.81 |
|
US Corporates A |
0.66 |
|
US Corporates BBB |
0.53 |
|
3 Month T-Bill |
0.08 |
|
U.S. High Yield Cash Pay BB |
0.05 |
|
U.S. High Yield Cash Pay BB-B |
-0.07 |
|
U.S. High Yield Cash Pay B |
-0.17 |
|
S&P 500 |
-0.17 |
|
U.S. High Yield Cash Pay CCC/CC/C |
-0.23 |
|
Russell 2000 |
-0.24 |
|
S&P/LCD All Loans |
-0.32 |
Source: BofA Merrill Lynch High Yield Strategy Research 01/13
While HQHY (as represented by the Merrill Lynch U.S. High Yield Cash Pay BB Index above) has a slightly positive correlation of 0.05, it still remains much less correlated than investment-grade bonds and even slightly less than three-month Treasury bills, which due to their short duration carry minimal interest-rate risk. Many anticipate a slight increase in corporate bonds’ correlation of returns with Treasuries across all quality spectrums due to the currently low absolute-yield levels. However, the historical limited correlation of HQHY issues is consistent with the high-yield market in general and this may appeal to investors concerned with an eventual rise in inflationary pressure and/or Treasury rates.
Conclusion
The high-yield market has seen dramatic inflows over the last few years as a result of immense Fed action to increase liquidity. We feel the increased enthusiasm surrounding the high-yield market is related to the yield offered relative to a benign credit environment as well as its limited historical correlation to the Treasury market. However, the U.S. economic recovery remains anemic and subject to exogenous factors and shocks, which could suddenly impact capital market flows. Many of the new nontraditional investors in high-yield securities may maintain lower loss tolerances and more willingness to exit the market during a “flight-to-quality” movement. This raises the potential for increased volatility in the future independent of today’s low default rate and accommodative credit environment.
Research suggests that over time and during periods of negative volatility a focus on HQHY within the broader high-yield market may offer the most compelling risk/reward alternative. This higher-quality segment of the high-yield market still exhibits the limited correlation to the Treasury market that many investors are searching for today.
The views expressed herein are those of the Fixed Income team and do not pertain to all investment strategies offered by Denver Investments or Westcore Funds. The views expressed are general in nature and actual events may cause adjustments in portfolio management strategies from those currently expected to be employed.
RISKS: The Westcore Fixed Income Funds are subject to additional risk in that they may invest in high-yield/high-risk bonds and generally will be subject to greater levels of liquidity risk. Additionally, investing in bond funds entails interest-rate risk and credit risk.
All indices are unmanaged and index performance figures do not reflect any fees, expenses or taxes. Investors cannot invest directly in an index.
Barclays is the source and owner of the Barclays Index data contained in this material and all trademarks and copyrights related thereto. Any further dissemination or redistribution is strictly prohibited. Barclays is not responsible for the formatting or configuration of this material or for any inaccuracy in Denver Investments’ presentation thereof.
An investor should consider investment objectives, risks, charges and expenses of the Fund(s) carefully before investing. This material must be accompanied or preceded by a prospectus, which contains this and other important information about the Fund(s). To obtain additional copies of the prospectus, please call 800.734.WEST (9378) or visit us online at ww.westcore.com. Please read the prospectus carefully before investing.
Westcore Funds are distributed by ALPS Distributors, Inc.
The mountain logo together with “Westcore Funds Denver Investments” is a registered service mark of Denver Investments. WES001948 04302013
© Westcore Funds Denver Investments