There was plenty of news to threaten the recent market rallies but, as of writing, we’re within a whisper of all time highs in US stocks and managing to have a very orderly consolidation in bonds. This is surprising because the political process has once again taken careful aim and shot itself in the foot. The sequester has become the dumb answer to difficult questions and will initiate, mostly indiscriminate, across-the-board cuts. The markets have done mostly what they did with the fiscal cliff: wonder, shrug, announce a plague on both houses and kept moving. Here's the run down on three things that came at us:
1. Sequester
The headline total is about $110bn over two years and comes from the Budget Control Act of 2011. It is a straight cut to budget expenditures and meant to be equally painful to all discretionary spending…so it does not touch Medicaid or Social Security. It was effective January 1st 2013 but postponed until March 1st. Some $88bn of the cuts fall in 2013, the rest next year. About half is defense spending but excludes uniformed military personnel. Depending on timing, it’s a hit to GDP of about 0.5% this year and 0.1% next year.
There are two effects of the sequestration. One, that if there's no middle ground on a relatively small issue, then what are the hopes of something bigger like the budget, continuing resolution and debt ceiling? Two, that GDP can ill afford more contraction in fiscal policy. In the latest GDP revisions for Q4 2012, we went from -0.1% to 0.1% or, put another way, we increased the economy by an annual rate of $4bn. Government expenditures contributed -1.38% to growth. Here's the year over year growth in government expenditures.
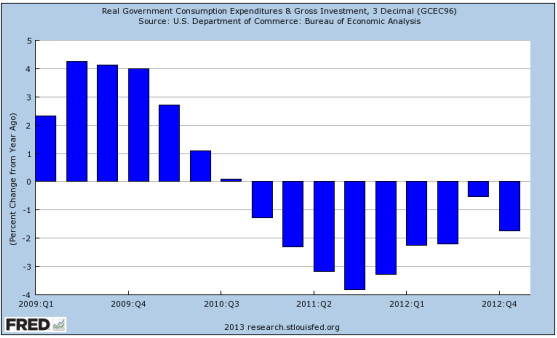
Source: Federal Reserve Bank of St. Louis, Economic Research
Now, while there may be a bounce in Q1 2013 spending to adjust for the shift in defense spending that was brought forward from Q4 to Q3 (thus over stating the decline in Q4), this is a real dampener to confidence when the economy is already facing weak export growth, slow inventory building and consumer spending. So lump on the sequester and we are really playing with fire.
2. Italy
Italy itself is not that important. Its markets are not big enough to sway flows or sentiment. But it is very emblematic of EU collaboration and unity. Quite simply, the market was complacent over these elections and underestimated the byzantine world of Italian politics.
Yes, yes, but what does it mean?
The election was a rejection of some of the austerity measures but not a rejection of the EU or its policies. It postpones labor and product markets reform but it’s emphatically not a precursor to any rise of extremist parties (e.g. Catalonia secession in Spain or le Pen in France) or return to the bad old days of lira inflation. While we have to wait to see who takes up the PM role and we have more weeks of uncertainty, this is not prelude to dismantlement or crisis.
Markets were pricing in a benign outcome but were also looking for a reason to sell off after a 22% rise in the Italian stock market over six weeks. So we saw an 8% correction in equities and a 3 point correction in bonds. The bond market, which is the true fear barometer, took things well. An auction of 10-year bonds mid- week came in at 4.8% with a stronger bid/cover than the January auction. As of the end of the week, the rates were holding and the debate is on the composition of what will likely be an interim government. Unless yields hit the 5.5% level, Italy will not needECBsupport and so will not have to sign on to a formalOMTand austerity program. We continue to hold Italian equities.
3. Bernanke in Testimony
The Fed is outwardly arguing its dual mandate. The hawks are i) pressing on asset price inflation ii) extremely uncomfortable with both the unemployment mandate and iii) QE buying. But these are Fed "participants" notFOMC"members". The only people that count are Bernanke, Yellen and Dudley. They (and Bernanke’s testimony) are not giving one inch of ground to the hawks. QE will continue until they see "substantial improvement: in the labor market". The GDP numbers, weaker than any of the estimates, give them no reason to have any optimism that we’re on a strong path.
The general tone of economic reports last week was steady and up. So we had a better report on durable goods once the erratic aircraft order series was excluded. This is what it looks like using year over year numbers.
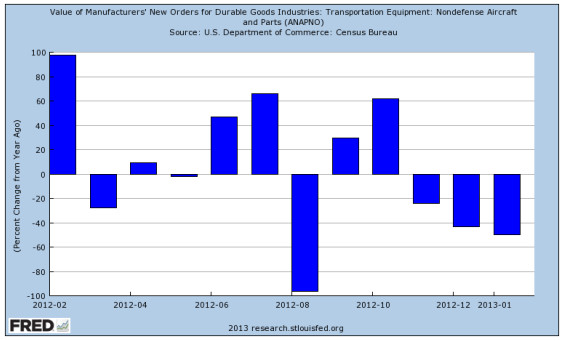
Source: Federal Reserve Bank of St. Louis, Economic Research
But the core new orders numbers looked a lot stronger, at +1.9% over the month grew for the fifth straight month.
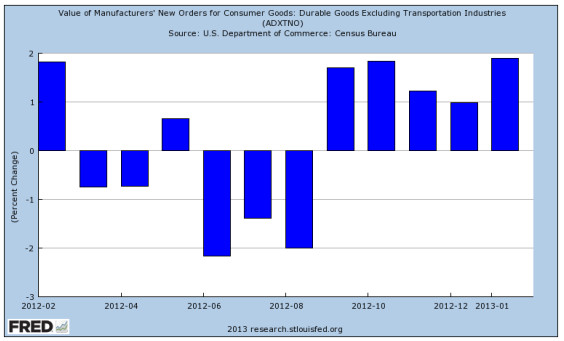
Source: Federal Reserve Bank of St. Louis, Economic Research
Finally, claims are trending better with a print below 350,000 and 4-week moving average of 355,000:
Source: Federal Reserve Bank of St. Louis, Economic Research
One nice update from the testimony was that the chairman brought up other "tools" that would normalize policy. First among these was the ability to retain assets and increaseIOER. We think the Fed will never sell from its balance sheet. In other words the "exit strategy" riddle has the simplest answer: run off until maturity. This clearly underpins the market and means that large overseas holders (so China and Japan) need not worry about a disorderly exit and upset of the bond market.
Bonds
We are at around 1.87% on the 10-year which is exactly where we were in mid-January. In other words, GTs weakened as the market thought that Q4 GDP was not as bad as the print but strengthened as the risks of:
- payroll tax turning into a bigger deal than expected;
- higher gas prices (+15% YTD) biting into consumer spending;
- sequester going ahead followed by continuing resolution and debt ceiling; and
- indicators likeNFIB, personal income and Philly Fed looking weak
…all came to the fore. In other words, we’re in the 2% GDP world again with a soft Q1.
Also, we had a break down in the GT10 range. We had 22 straight trading sessions between 1.95% and 2.05%. Every time we got to 2.05% the tone would change and we would rally. The recent move below 1.90% changes the range a bit and if we get a decisive break to the 1.80% level, we would put on the shorts.
We have to be careful in these markets because people are used to buying the dips. Last week the GT10 was at par and ¾, then ran to 101 ½ then back to 101 ¼. We had a good 7-year auction and an index extension later in the week. Both helped the buying.
Elsewhere, in credit spreads are narrow, the New Issue Market is well bid but secondaries weaker. We had some very tight spreads on news issues. The high yield market looks vulnerable.
Equities
Stocks are on a breather. As long as the 1450 level holds, there's not likely to be a correction of any size. We’re buyers at these levels and below.
Why are we buyers?
- Housing indicators (so starts, pending sales, final sales, Case-Schiller, HD[1], mortgage rates) are all helping the wealth affect along. Nothing like 2006 crazy but at the margin. And that’s what counts.
- Easy money in US and now Japan. That helps rates, which helps interest costs, which helps sales growth which helps stocks.
- More dividend stories to support the market.
- Also good capital management announcements.
- Here's how you can get to a decent outlook (not a prediction) on stocks in the S&P 500[2]:
- i. start with a dividend of 2.3%, add in gross share,
- ii. plus gross share buy backs of 4.8% (which is annualized rate YTD),
- iii. plus M&A for public companies at 1% of S&P,
- iv. less stock issuance for options at 1%,
- v. equals 7.1% effective return
…and forward earnings on the market are in the $110 range so 13.5x, which has a lot of support.
Bottom Line: So, stay calm. The more headline drama, the more the market will trade en bloc or beta if Greek is your thing. That’s not good for alpha generation in the short-term but allows for great buying. We’re overweight equities with our own and client money and will stay that way.
Sources: Bloomberg, Capital Economics, CRT Ader, Economist Free Exchange, Federal Reserve Bank of St. Louis, IMF Fiscal Monitor, Federal Reserve Bank of Kansas, Federal Reserve Bank of New York, Federal Reserve Bank of Philadelphia, Federal Reserve Board, Bureau of Labor Statistics, Bureau of Economic Analysis, US Department of Commerce, US Census Bureau, US Dept of Housing & Urban Development, ISI, J.P. Morgan Market Intelligence, High Frequency Economics, Pantheon MacroEconomic Advisors, Sentinel Asset Management, Inc.
[1] There was a position in Home Depot (HD) as of March 1, 2013. To see Sentinel Investments' Top 10 Holdings for all funds, please clickhere.
[2] Standard & Poor's 500 Index is an unmanaged index of 500 widely held US equity securities chosen for market size, liquidity, and industry group representation. An investment cannot be made directly in an index.
© Sentinel Investments